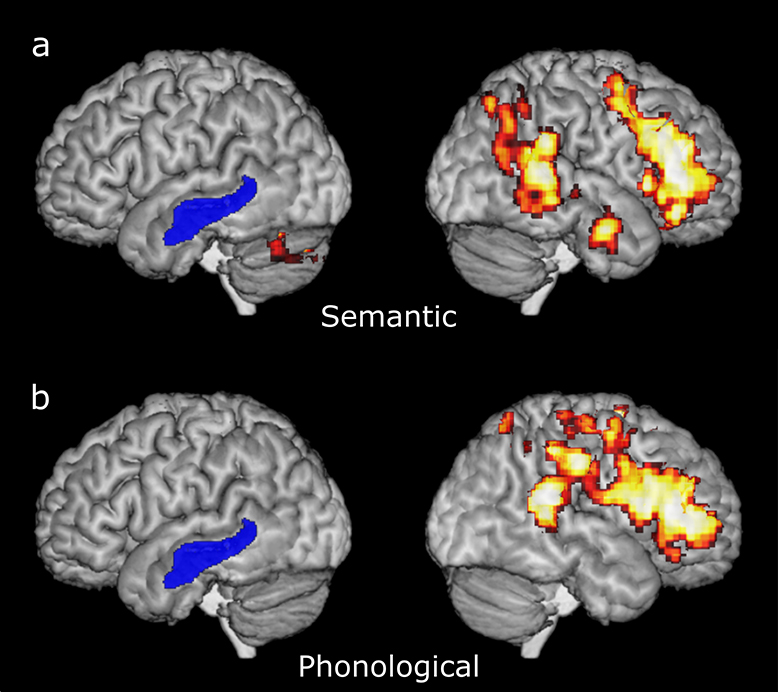
Figure 2.
Language activation maps derived from the adaptive semantic matching paradigm (2a) and the adaptive rhyme judgment paradigm (2b). Voxels with the highest 5% of t statistics for each contrast between the language and control conditions were plotted, subject to a minimum cluster volume of 2000 mm 3. Color scale ranges from 5% to 0%. Left is left. Blue represents lesion.

