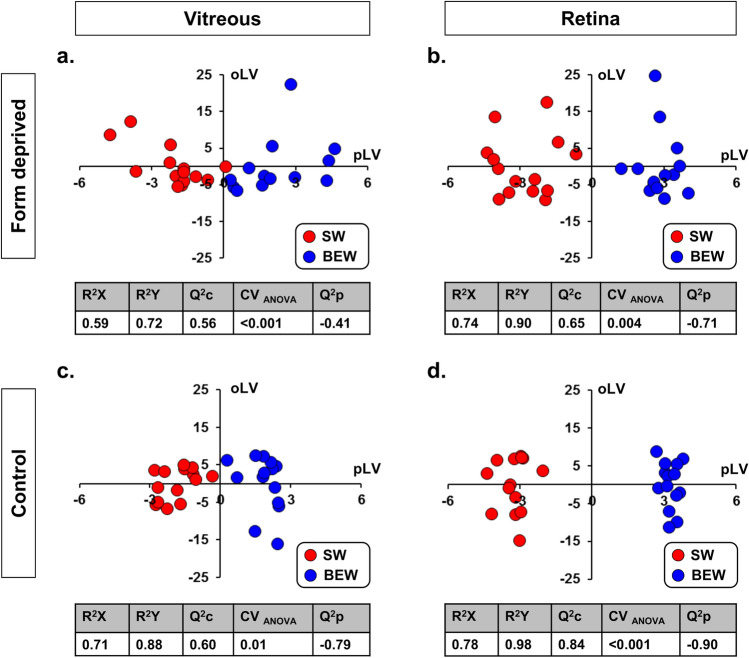
Figure 7.
OPLS-DA on the metabolomic profiles of the vitreous and retina in recovering FDEP and control eyes. The metabolomic profiles were significantly different in the vitreous (a) and retina (b) of FDEP eyes of animals reared under SW or BEW light with Q2c scores of 0.56 and 0.65, respectively. Similarly, the metabolomic profiles were significantly different in the vitreous (c) and retina (d) of control eyes between animals reared under SW and BEW lights with Q2c scores of 0.60 and 0.84, respectively.

