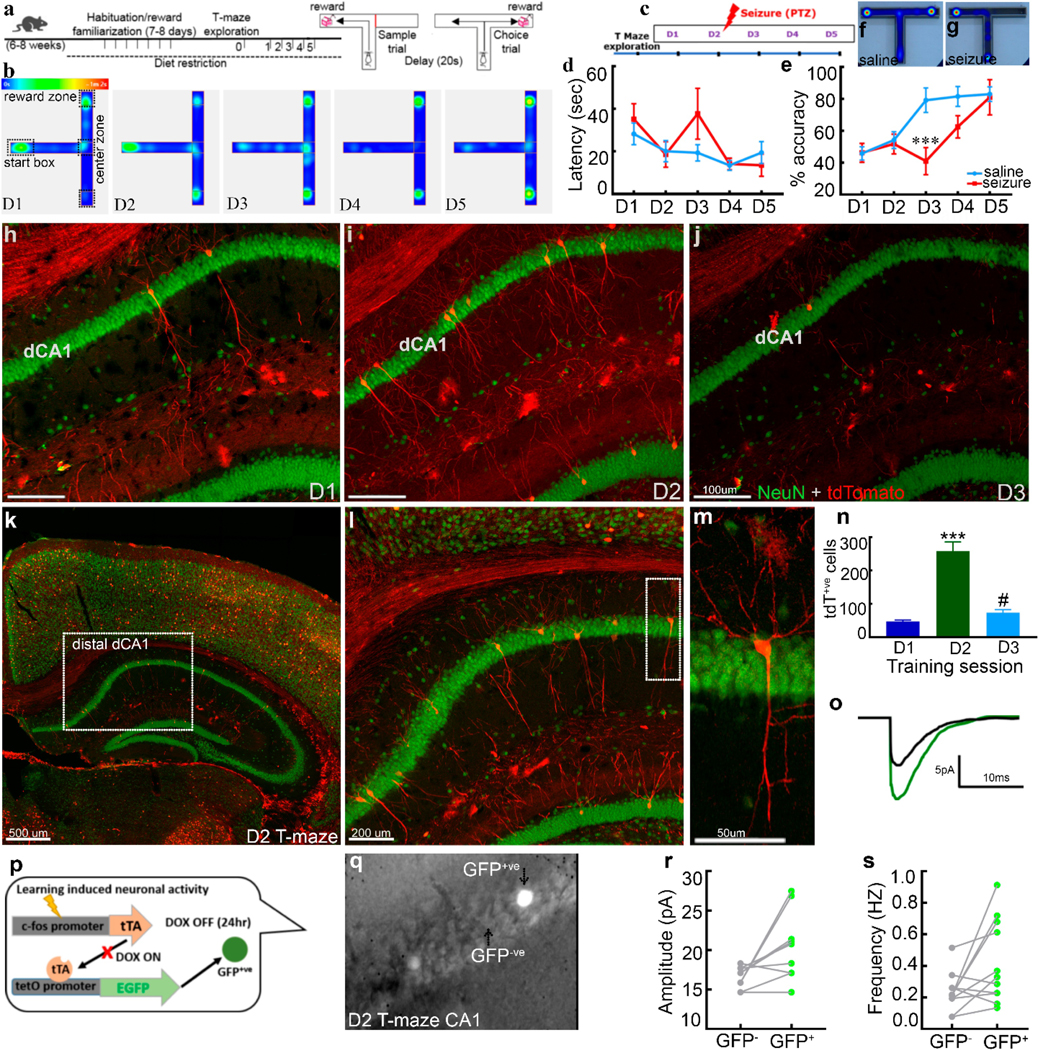
Fig. 1. Learning curve and associated CA1 engram for a spatial memory task.

a) Schematic of experimental design for T-maze task with a graphical representation of sample and choice phases. b) Representative raw heatmap shows mouse activity on T-maze across training sessions (day1–5). Mice did not alternate and spent time spent in the start box on D1 and D2. Successive heatmaps (D3-D5) show mice alternating successfully and spending less time in the center zone. c) Schematic of the experimental plan studying the effect of seizures induced by PTZ administered 15 minutes after the second day of training. d) The latency to complete the choice trial. The latency to reach a reward arm was not different in tow groups suggesting that seizure does not cause motor deficits. e) Alternation accuracy across training sessions in saline-injected controls versus mice that had a seizure following training on the second day. The inflection inefficiency by day 3 indicates learning occurred on day 2 with stable alternation success rates maintained on days 4 and 5. A seizure immediately after training on day 2 induces retrograde amnesia. However, increased accuracy by day 4 supports the transient nature of the effect. Heatmaps show alternation success in saline (f) and alternation failure (g) in the seizure group. Representative images show tdTomato+ve neurons (training-activated, red) with NeuN (green) counterstaining in CA1 hippocampus across training sessions on days 1 to 3 from 3 different mice, day 1 (h), day 2 (i) and day 3 (j). Day 2 shows the maximum number of learning tagged CA1 neurons in distal-dorsal CA1 (distal to CA3). (k), supporting their engram-nature, (l) displays a magnified view of the dotted square.m) A magnified view of the dotted rectangle showing typical morphology and the dendritic tree of a CA1 pyramidal neuron (red, tdT labeled).n) Number of tagged CA1 pyramidal neurons across training sessions increased following second day of training. Schematic of TetTag mouse genetics (p) used for electrophysiological studies, representative averaged EPSC traces (o) from GFP+ve (training-activated, green) and neighboring GFP-ve CA1 pyramidal neuron (DIC image, bright cells on day 2, GFP+ve, (q)). Graphs show enhanced amplitude (r) and frequency (s) of EPSC’s following second day of training on T-maze (11 pairs of GFP+ve and GFP-ve CA1 neurons from 8 animals). Data are presented as mean ± SEM, n=8 for each training day (e, P<0.01), n=6 mice for each training day (n), *** represents significance with P<0.001 compared to day 1, # represents P<0.05 compared to day 2).
