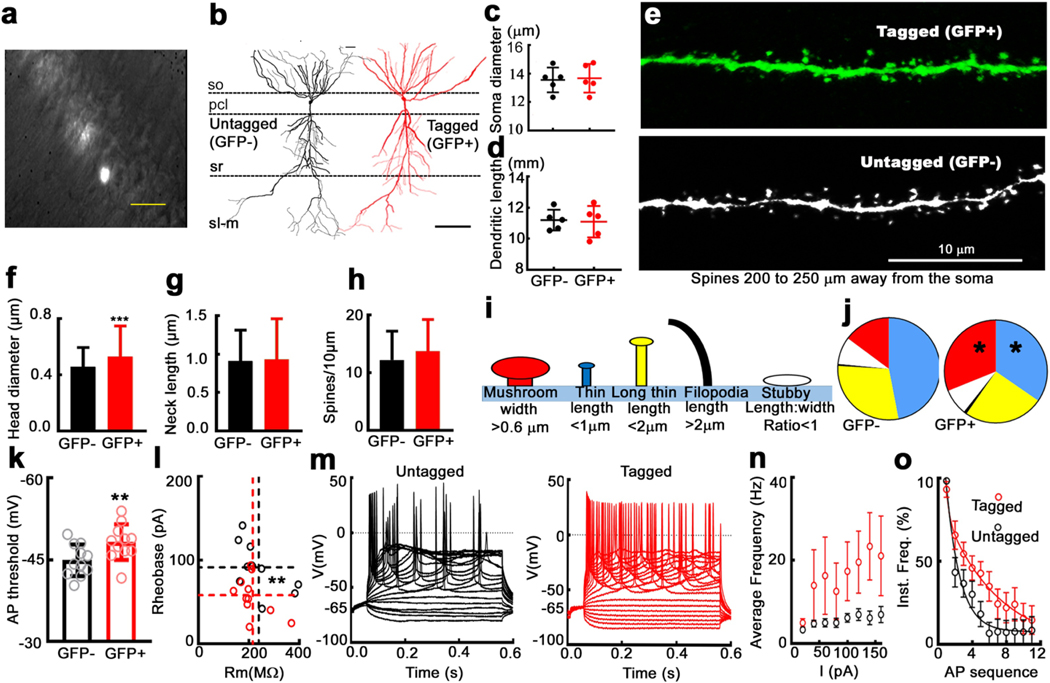
Fig. 5: Hippocampal CA1 neurons tagged by a seizure have larger dendritic spines and are more excitable.
a) A fluorescent/DIC image showing hippocampal CA1 region in an acute hippocampal slice obtained from a c-fos/EGFP mouse after a single seizure. Tagged neurons are shown as bright ones in the image. The scale bar is 50 μm. Total 11 tagged neurons and 11 untagged surrounding neurons were tested for their membrane properties. b) A tagged CA1 neuron reconstructed through tracing using Imaris program (red). A non-tagged CA1 neuron (black) is shown for comparison. The scale bar represents to 100 μm. c) and d) Soma diameter and total dendritic length analyzed for tagged (GFP+ve) and non-tagged (GFP-ve) CA1 neurons (5 cells from 5 animals for each group, mean ± SD, P = 0.8526 for the dendritic length, P = 0.8472 for the soma diameter). e) Examples of dendritic sections obtained from a tagged and a non-tagged neurons, which were 200 to 250 μm away from the somas (s. radiatum area). Spine dimensional analysis was performed for tagged neurons and untagged neurons (5 neurons from 5 animals for each group, see F, G, H, I and J). f) Spine-head diameter for spines 200 to 250 mm away from the somas. Mean ± SD for 432 spines from 5 untagged neurons (black), and 444 spines from 5 tagged neurons (red). ***P < 0.0001. g) Spine-neck length for spines analyzed in c). P = 0.276. h) Spine number in 10 μm dendritic sections (density) for those spines analyzed in c). P = 0.931. i) A schematic illustrating classification of spines based on their morphology. j) Percentage of spines of each type (illustrated in panel i) for tagged and untagged neurons. * P = 0.0204 for mushroom shaped spines (red) and * P= 0.0431 for thin spines (blue). Long-thin spine (yellow), P = 0.4172; filopodia, black, P = 0.5861; Stubby, white, P = 0.8839. k) Action-potential (AP) threshold for tagged (red) and untagged (black) neurons (−48.23 ± 3.264 mV vs. −44.89 ± 2.891 mV, paired t-test, ** P = 0.0017). AP was evoked by current injection. AP threshold was measured from the first AP evoked during current injections. Initial point of AP upstroke phase is the threshold. l) Membrane resistance vs. rheobass for tagged (red circles) and untagged (black circles) neurons (** P = 0.007 for rheobass, P = 0.213 for Rm. Dashed lines show the mean values). m) Traces illustrate AP’s evoked at different current injections for a tagged and an untagged neurons. Current injections was performed from −100 pA to 300 pA with 20 pA increasing step, and lasted for 500 ms. To compare firing patterns between neurons, membrane potential was adjusted to −65 mV by using a small amount of current before the injections. n) Frequency-current (F-I) plot illustrating the frequency of AP’s evoked by each current injection, values are mean ± SD (n=11 per group. P < 0.0001, Two-way ANOVA). o) Instantaneous frequency vs. action potential sequence based on analysis of APs evoked by current injection, examples shown in m. The values represent mean ± SD, n=11 in each group. The lines represent two-phase exponential fit of the data (fast decay tau is 0.356, slow decay tau is 6.380).

