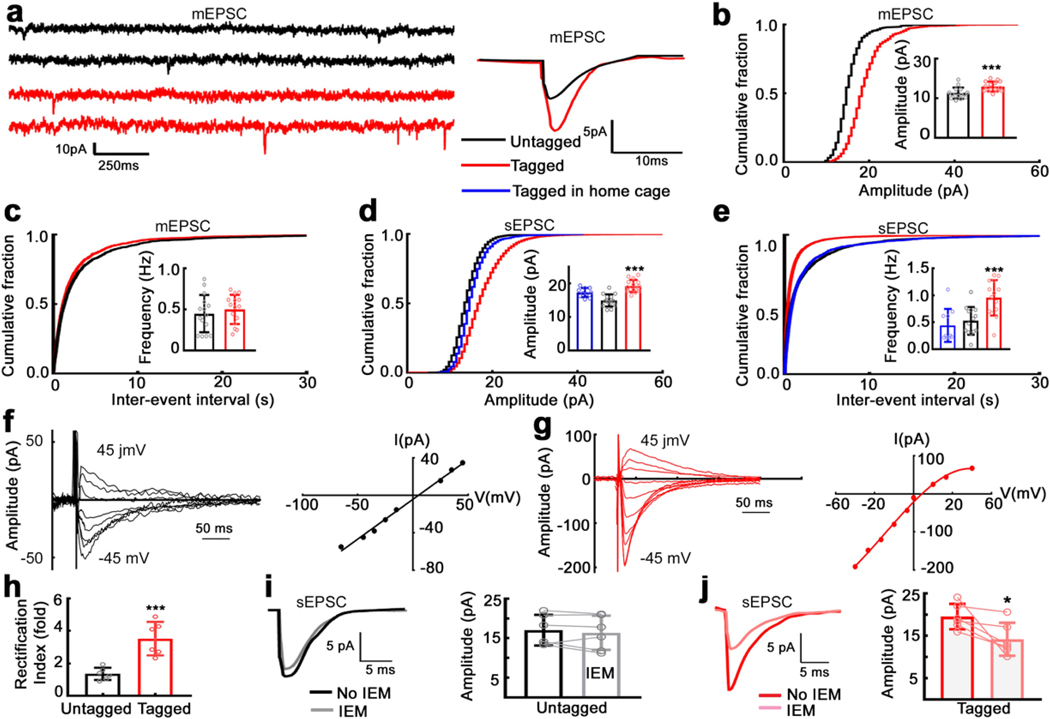
Fig. 6. AMPA synaptic transmission is enhanced in hippocampal CA1 neurons tagged by a single seizure.
a). Traces illustrating mEPSCs recorded from an untagged (black) and a tagged (red) CA1 neurons in animals which experienced PTZ-induced single seizure. These two neurons were recorded from the same acute slice. Averaged traces of mEPSCs from those two cells are also shown. b) Cumulative fraction curves illustrating distribution of mEPSC amplitudes. n = 15 cells for each group. The inserted graph shows mean of median mEPSC amplitudes andSD (paired t-test, *** P = 0.0002). c) Cumulative fraction curves illustrating distribution of mEPSC inter-event intervals. n = 15 cells for each group. The inserted graph shows the mean ± SD of mEPSC frequency (paired t – test, p = 0.5418). d) Cumulative fractions of sEPSC amplitude distributions for tagged and untagged CA1 neurons from PTZ seizure animals. Distribution of amplitudes of sEPSCs recorded from neurons activated under home cage-conditions are also plotted for comparison (blue). n= 15 each for untagged and tagged neurons from 15 seizure animals, and n= 10 tagged cells from 5 home cage-condition animals were analyzed. Inserted bar graph shows a comparison of sEPSC amplitude (means of median) for the three groups *** p<0.0001, one-way ANOVA. e) Cumulative fractions of sEPSC inter-event interval distributions for tagged and untagged CA1 neurons from PTZ seizure animals, and those neurons activated under home cage-conditions. Inserted bar graph shows a comparison of sEPSC frequency (mean ± SD) for the three groups (*** p = 0.0002, one-way ANOVA). f) Representative traces showing currents evoked at various holding potentials ranging from −45 mV to 45 mV recorded from an untagged neurons of a seizure animal. A linear I-V curve plotted from the same neuron. g) Representative traces showing currents evoked at various holding potentials from a tagged neurons of a seizure animal. Note the inwardly-rectifying currents. The I-V curve plotted from the same neuron illustrate a nonlinear I/V curve. h) Rectification index, a ratio of the current evoked at −45 mV to that at 45 mV, n= 6 in each group, *** P = 0.0007. i) Right panel shows averaged sEPSCs recorded from an untagged neuron before and after application of IEM 1460 (100 μM), a ca2+-permeable AMPA receptor blocker. Bar chart shows sEPSC amplitude for group results. n=6 neurons from 4 animals, mean ± SD, paired t-test, P = 0.0929. Pale color circles indicate mean results from individual neurons, lines linking results before and after the application of IEM1460. j) Right panel shows averaged sEPSCs recorded from a tagged neuron before and after application of IEM 1460 (100 μM), Bar chart shows sEPSC amplitude for group results. n=6 neurons from 4 animals, mean ± SD, paired t-test, *P = 0.0379. Pale color circles indicate mean results from individual neurons, lines linking results before and after the application of IEM1460

