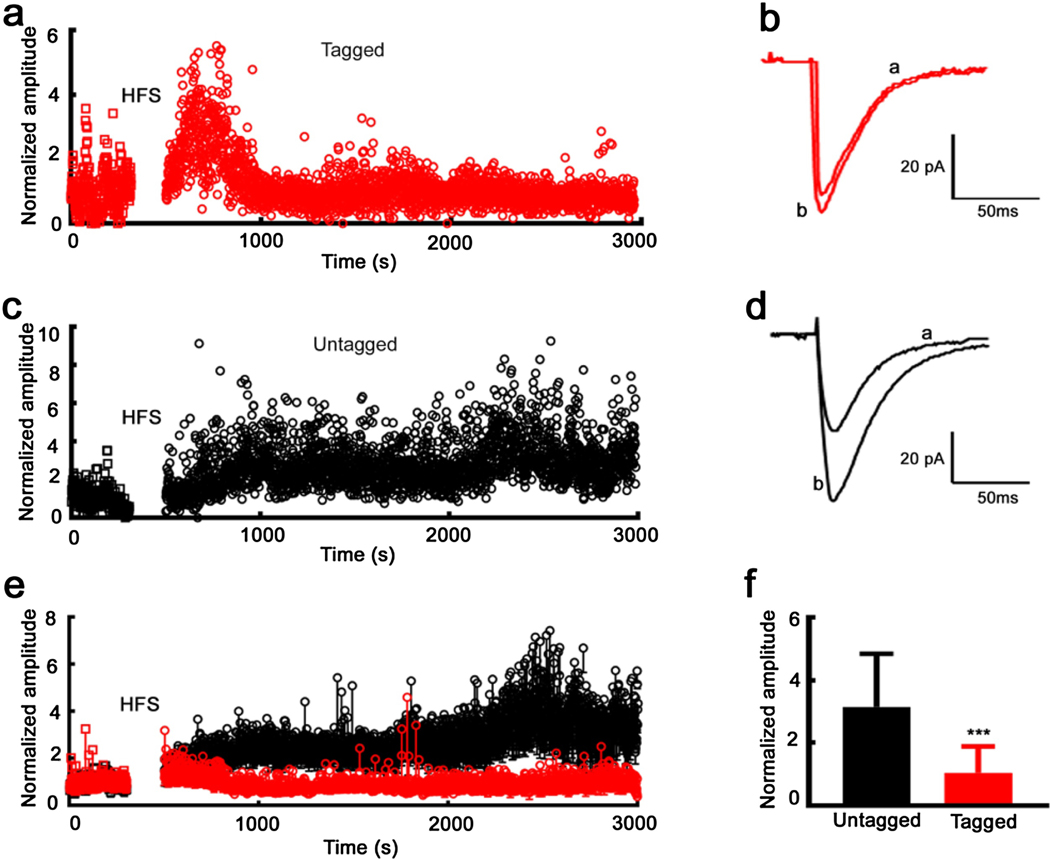
Fig. 7. Saturated LTP in tagged neurons after a single seizure.
a). Time course of eEPSC amplitudes recorded from a tagged neuron. The amplitudes were normalized by the mean of control recordings before HFS. b). Average traces of eEPSCs for the tagged cell exhibited in A) before (a), and after (b) the application of HFS. c). Time course of eEPSC amplitude recorded from an untagged neuron. The amplitudes were normalized by the mean of control recordings before HFS. d). Average traces of eEPSCs obtained from the untagged neuron shown in panel C) before (a), and after (b) the application of HFS. e). Time course of normalized eEPSC amplitudes for tagged neurons (7 cells from 7 animals, red), and untagged neurons (6 cells from 6 animals, black), mean ± SD. f) Mean ± SD of eEPSC amplitudes after HFS for tagged and untagged neurons shown in panel E). The amplitudes were normalized by the mean of control recordings, *** P < 0.0001.

