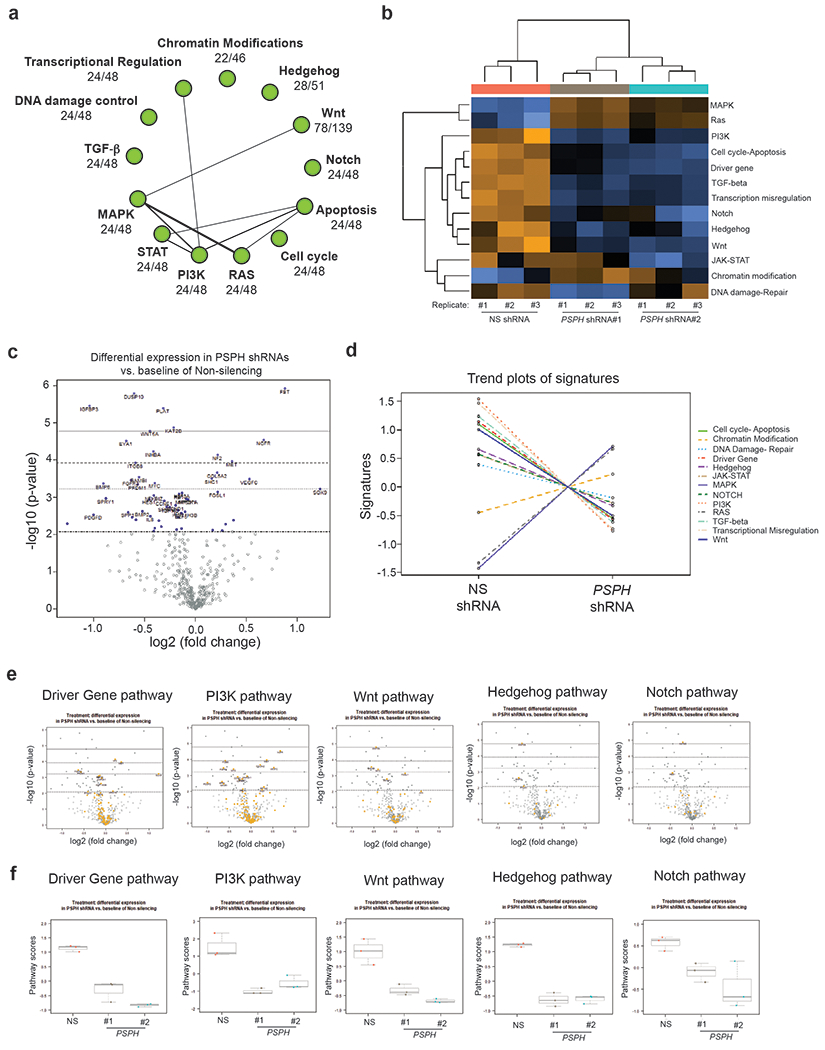
Fig. 6. PSPH loss results in reduced expression of cancer-promoting pathways and gene signatures.

a. The signaling network regulated by PSPH was identified using NanoString analysis of gene expression in A375 cells after PSPH knockdown. b. A heatmap showing the gene expression profile of A375 cells expressing PSPH shRNAs or an NS shRNA by NanoString analysis. c. Volcano plot illustrating the gene expression profile of A375 cells expressing PSPH shRNAs or a nonspecific (NS) shRNA, as analyzed by NanoString. d. Trend plots of pathway signatures from NanoString analysis performed in A375 cells expressing PSPH shRNAs relative to a nonspecific (NS) shRNA. e. Volcano plot showing the gene expression profile of candidate pathways in A375 cells expressing PSPH shRNAs or a nonspecific (NS) shRNA. f. Pathway scores for the indicated pathways from NanoString analysis performed in A375 cells expressing PSPH shRNAs or a nonspecific (NS) shRNA.
