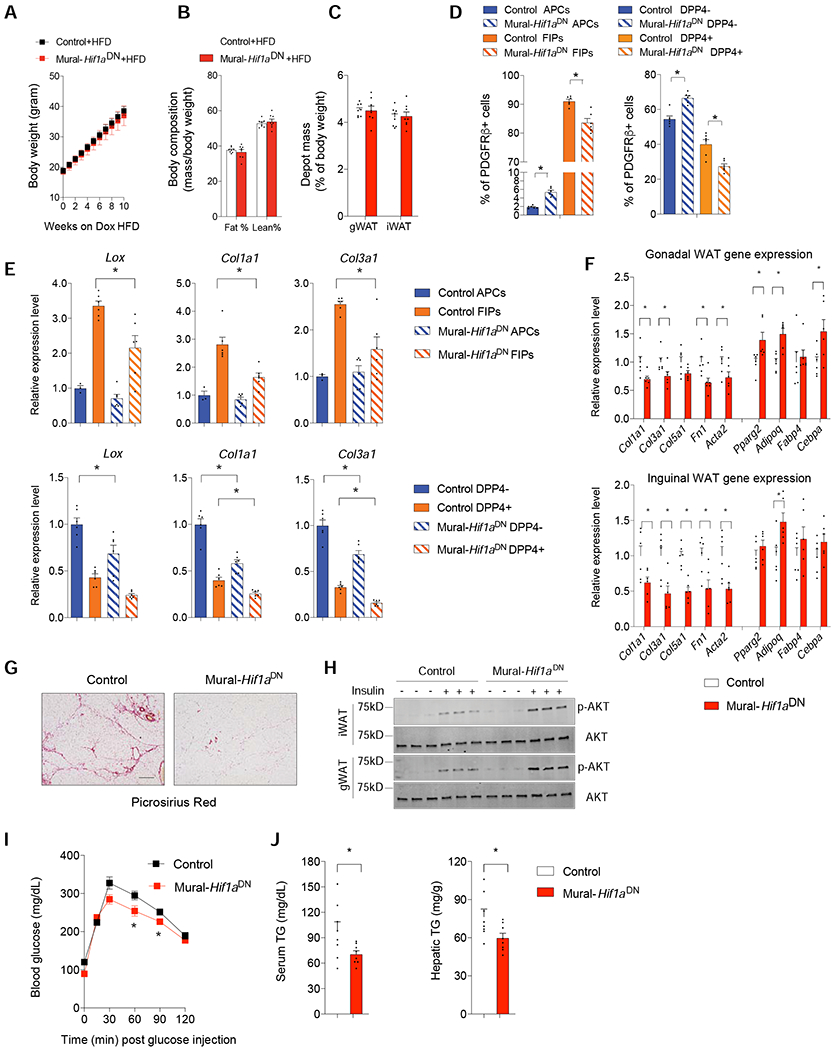
Figure 3. Suppression of Mural Cell HIFα Activity Attenuates Adipose Tissue Fibrosis in Obesity.

(A) Weekly body weights of Control and Mural-Hif1aDN mice following the onset of Dox-HFD feeding.
(B) Fat mass and lean mass after 10 weeks of Dox-HFD feeding. n=6 mice per genotype.
(C) Depot mass after 10 weeks of Dox-HFD feeding. n=6 mice per genotype.
(D) Relative frequency of PDGFRβ+ subpopulations within gWAT (left) and iWAT (right) after 10 weeks of Dox-HFD feeding. n= 6 mice per genotype. Bars represent mean + s.e.m. * denotes p< 0.05 by two-way ANOVA.
(E) mRNA levels of indicated fibrosis-related genes within gWAT APCs and FIPs (top), and iWAT DPP4− and DPP4+ PDGFRβ+ cells (bottom) after 10 weeks of Dox-HFD feeding.
Each sample (n) represents 10,000 freshly isolated cells from 2-3 individual depots. n= 3 for Control APCs. n= 6 for all other subpopulations. Bars represent mean + s.e.m. * denotes p< 0.05 by two-way ANOVA.
(F) mRNA levels of indicated fibrosis- and adipogenesis-related genes in whole gWAT (top) and iWAT (bottom) depots mice after 10 weeks of dox-HFD feeding. n=6 mice per genotype. Bars represent mean + s.e.m. * denotes p< 0.05 by Student’s t-test.
(G) Representative bright-field image of collagen deposition (red) in iWAT after 10 weeks of dox-HFD feeding. Scale bar denotes 200 μm.
(H) Western blot of phosphorylated AKT (p-AKT) and total AKT in iWAT and gWAT after 10 weeks of Dox-HFD feeding.
(I) Glucose tolerance tests after 10 weeks of Dox-HFD feeding. n= 8 per genotype. Bars represent mean + s.e.m. * denotes p< 0.05 by two-way ANOVA.
(J) Serum and hepatic triglycerides levels after 10 weeks of Dox-HFD feeding. n= 8 mice per genotype. Bars represent mean + s.e.m. * denotes p< 0.05 by Student’s t-test.
