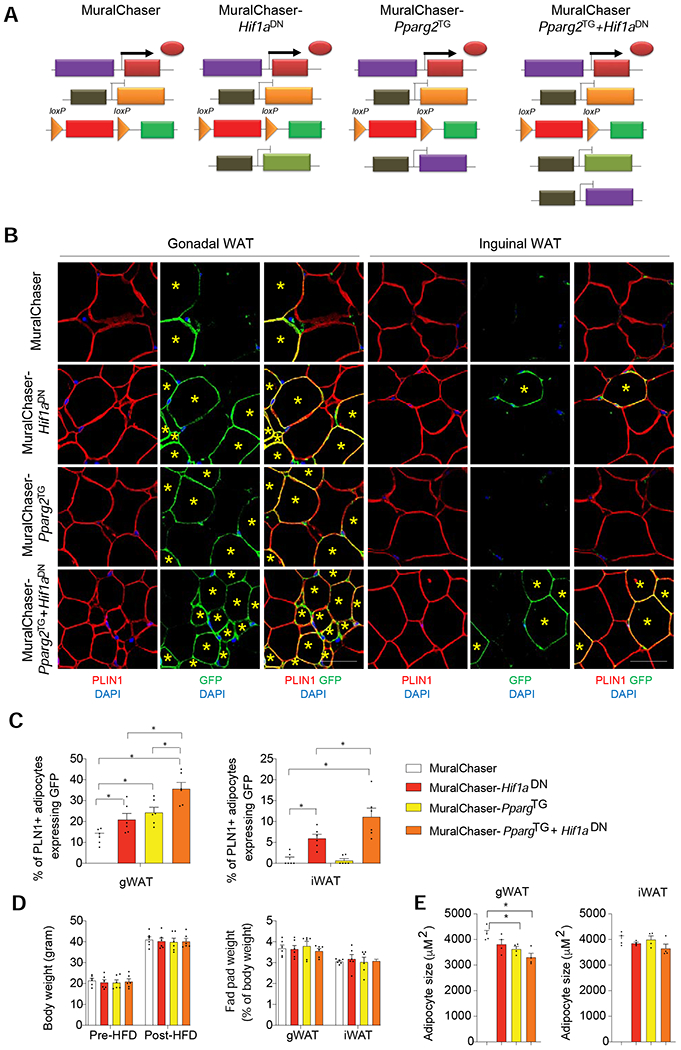
Figure 4. Suppression of mural cell HIF1α activity promotes subcutaneous and visceral adipogenesis in obesity.

(A) Genetic models utilized in lineage tracing experiments: MuralChaser mice enable fate-mapping of PDGFRβ+ cells. MuralChaser-Hif1aDN mice enable fate-mapping of PDGFRβ+ cells expressing Hif1aDN. MuralChaser-Pparg2TG enable fate-mapping of PDGFRβ+ cells overexpressing Pparg2. MuralChaser-Pparg2TG+Hif1aDN mice enable fate-mapping of PDGFRβ+ cells co-expressing both Hif1aDN and Pparg2 transgenes.
(B) Indirect immunofluorescence images of GFP (green) and PLIN1 (red) expression in gWAT and iWAT from mice of the indicated genotypes after 10 weeks Dox-HFD feeding. New adipocytes (yellow star) emerging from PDGFRβ+ cells are marked with GFP expression. Scale bar denotes 50 μm.
(C) Percentage of PLN1+ adipocytes expressing GFP in gWAT (left) and iWAT (right) from mice of the indicated genotypes. n= 6 mice per genotype, bars represent mean + s.e.m. * denotes p< 0.05 by one-way ANOVA.
(D) (Left) Body weights of the mice utilized in the lineage tracing experiments pre- and post-HFD feeding. (Right) WAT depot mass measured after 10 weeks of dox-HFD feeding. n= 6 mice per genotype.
(E) Average adipocyte size in gWAT and iWAT from mice of the indicated genotypes after Dox-HFD feeding. n=4 per genotype. Bars represent mean + s.e.m. * denotes p< 0.05 by one-way ANOVA.
