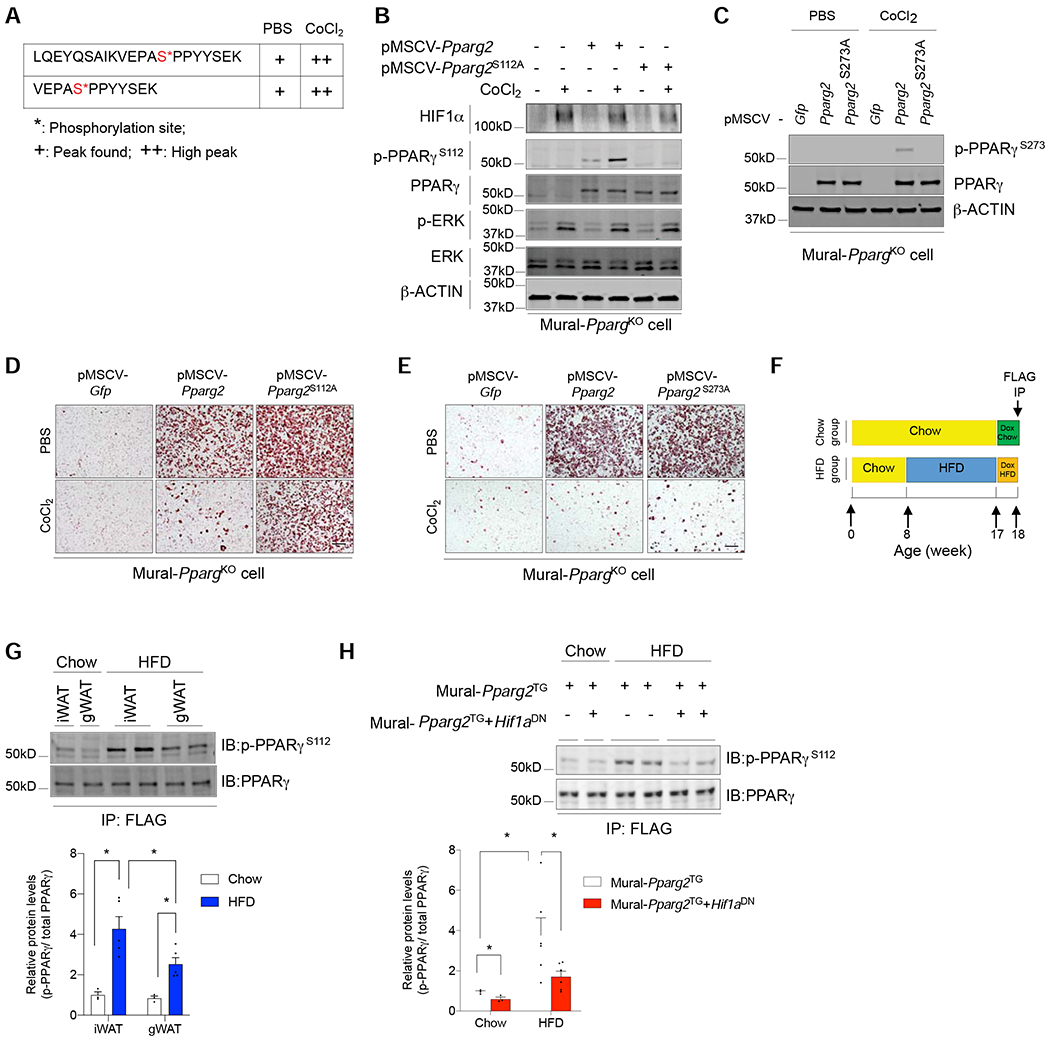
Figure 5. HIF1α activation induces inhibitory PPARγ S112 phosphorylation in WAT PDGFRβ+ cells.

(A) Mass spectrometry analysis of affinity purified FLAG-PPARγ isolated from iWAT PDGFRβ+ cells identifies two peptides carrying phosphorylated serine sites corresponding to PPARγ serine 112 (S112), with increasing signal (+) detected after the addition of CoCl2 for 24 hours.
(B) Western blot analysis of levels of indicated proteins in Pparg-deficient iWAT PDGFRβ+ cells transduced with retrovirus expressing either GFP, PPARγ2, or the PPARγ2 S112A (serine 112 to alanine) variant. Cells were treated with 50 μM CoCl2 or vehicle for 24 hours prior to lysis.
(C) Western blot analysis of levels of indicated proteins in Pparg-deficient iWAT PDGFRβ+ cells transduced with retrovirus expressing either GFP, PPARγ2, or the PPARγ2 S273A (serine 273 to alanine) variant. Cells were treated with 50 μM CoCl2 or vehicle for 24 hours prior to lysis.
(D) Oil-red O staining of adipocytes differentiated from CoCl2-treated Pparg-deficient iWAT PDGFRβ+ cells transduced with virus expressing GFP, PPARγ2, or the PPARγ2 S112A variant.
(E) Oil-red O staining of adipocytes differentiated from CoCl2-treated Pparg-deficient iWAT PDGFRβ+ cells transduced with virus expressing GFP, PPARγ2, or the PPARγ2 S273A variant. For D and E, scale bar denotes 200 μm.
(F) Assay of phosphorylated PPARγ in mural cells in vivo: 8 weeks-old Mural-PpargTG mice and Mural-Pparg2TG+Hif1aDN mice were maintained on chow or HFD for 10 weeks. Doxycycline was added during the last 7 days to induce expression of FLAG-tagged PPARγ protein in mural cells of Mural-PpargTG mice or FLAG-tagged PPARγ protein and HIF1αDN in Mural-Pparg2TG+Hif1aDN mice. Levels of PPARγ S112 phosphorylation were analyzed by western blot of affinity purified FLAG-tagged PPARγ protein (FLAG IP).
(G) Western blot (top) and quantification (bottom) of phosphorylated PPARγ within iWAT and gWAT mural cells of chow and HFD-fed mice. n= 3 for chow samples, n=5 for HFD samples. Bars represent mean + s.e.m. * denotes p< 0.05 by two-way ANOVA.
(H) Western blot (top) and quantification (bottom) of phosphorylated PPARγ within iWAT mural cells of chow and HFD-fed Mural-PpargTG mice and Mural-Pparg2TG+Hif1aDN mice. n= 3 for chow samples, n=6 for HFD samples. Bars represent mean + s.e.m. * denotes p< 0.05 by two-way ANOVA.
