
Figure 7: Imatinib treatment reduces mural cell PPARγ S112 phosphorylation and triggers iWAT and gWAT adipogenesis in obese mice.
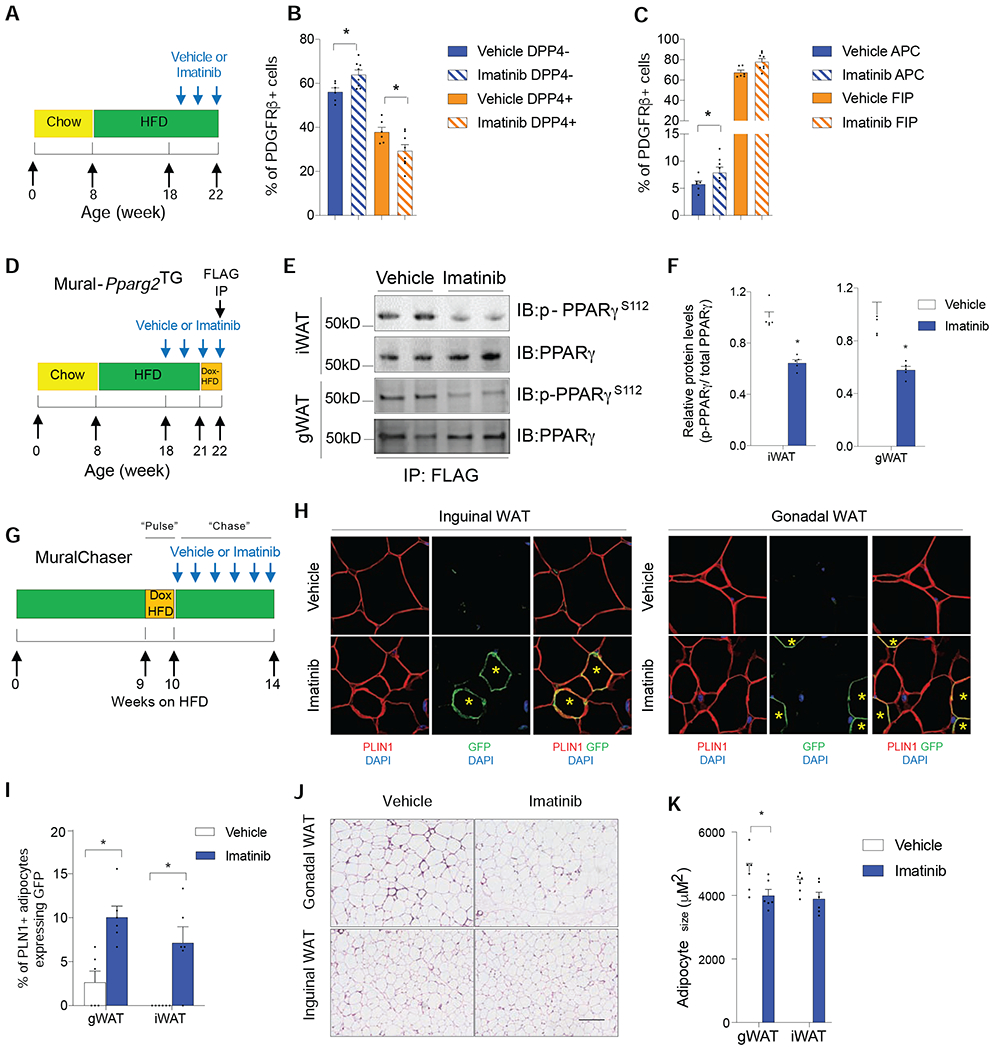
(A) 8 weeks-old C57BL/6 wildtype mice were fed a a HFD for 14 weeks. During the last 4 weeks, vehicle or Imatinib was administered four times weekly.
(B) Relative frequency of gWAT APCs and FIPs following treatment with Imatinib.
(C) Relative frequency of iWAT DPP4− APCs and DPP4+ APCs following treatment with Imatinib.
For panels B and C, n= 6. Bars represent mean + s.e.m. * denotes p< 0.05 by two-way ANOVA.
(D) Assay of PPARγ S112 phosphorylation in obese mice treated with Imatinib: 8 weeks-old Mural-Pparg2TG were fed a a HFD for 14 weeks. During the last 4 weeks, vehicle or Imatinib was administered four times weekly. During the last week of Imatinib treatment, mice were switched to Dox-HFD to induce the expression of FLAG-tagged Pparg2 transgene in PDGFRβ+ mural cells. FLAG-tagged PPARγ protein (anti-FLAG antibody) was then affinity purified from whole WAT depots for western blot analysis.
(E) Western blot of mural cell PPARγ S112 phosphorylation in WAT of obese Mural-Pparg2TG mice treated with vehicle or Imatinib.
(F) Quantification of mural cell PPARγ S112 phosphorylation in iWAT and gWAT of obese Mural-Pparg2TG mice treated with vehicle or Imatinib. n= 6 per group. Bars represent mean + s.e.m. * denotes p< 0.05 by Student’s t-test.
(G) Pulse-chase lineage tracing: Following 9 weeks of HFD-feeding, MuralChaser mice were switched to Dox-containing HFD for 1 week to induce labelling of existing PDGFRβ+ cells (“Pulse”). Mice were then switched back to HFD (without Dox) for an additional 4 weeks (“Chase”), during which vehicle or Imatinib was administered four times weekly.
(H) Indirect immunofluorescence images of GFP (green) and PLIN1 (red) expression in WAT of obese MuralChaser mice treated with either vehicle or Imatinib. Scale bar denotes 50 μm.
(I) Frequency of of GFP+ PLN1+ adipocytes in WAT of MuralChaser mice following Imatinib treatment. n= 6. Bars represent mean + s.e.m. * denotes p< 0.05 by Student’s t-test.
(J) H&E staining of WAT sections from mice treated with vehicle or Imatinib. Scale bar denotes 200 μm.
(K) Adipocyte size following treatment with vehicle or Imatinib. n=6 per group. Bars represent mean + s.e.m. * denotes p< 0.05 by Student’s t-test.