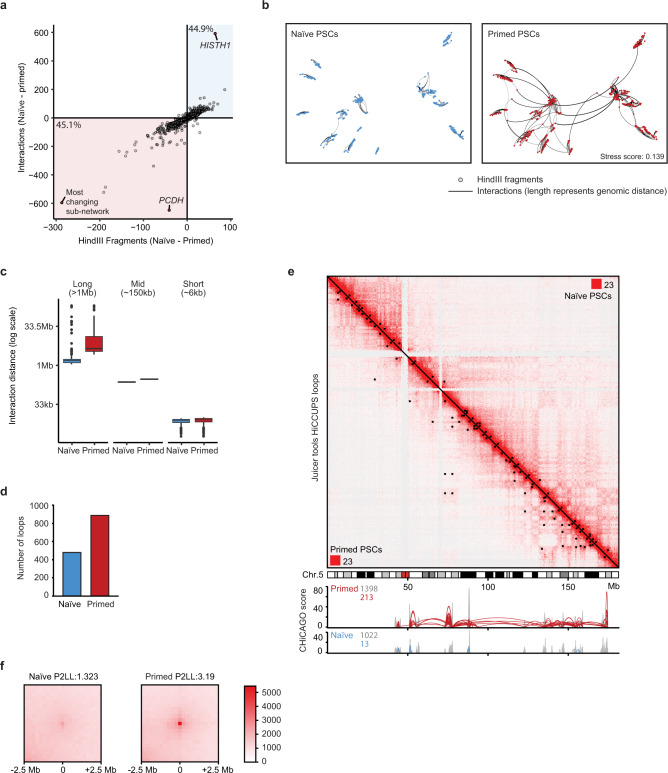
Fig. 2. Long-range promoter interactions in primed PSCs drive genome conformation changes between pluripotent states.
a Plot shows the number of interactions (edges) and the number of interacting HindIII fragments (nodes) for each sub-network in naive and primed PSCs. Each small circle represents a different, individual sub-network. The lower-left quadrant reveals sub-networks that are larger in primed PSCs, and the upper-right quadrant shows the small number of sub-networks that are larger in naive PSCs. The protocadherin (PCDH), histone H1 (HISTH1) and ‘most changing’ (containing diverse genes) sub-networks are highlighted in red. b Multidimensional scaling representation (MDS) of the ‘most changing’ sub-network plotted using the linear genomic distance between nodes as edge weights. The measured stress score of 0.139 indicates there is a reasonable fit between the linear genomic distances and the spacing of the nodes as determined by MDS111. c Plot shows the distribution of linear genomic distances between interacting nodes in naive and primed PSCs, binned into long-, mid-, and short-range distances (n = 1000). The box bounds the interquartile range (IQR) divided by the median (horizontal line), and Tukey-style whiskers extend to a maximum of 1.5 × IQR beyond the box. Circles indicate individual outliers. d Plot shows the total number of long-range chromatin interactions identified on all chromosomes in naive and primed PSCs. e Hi-C interaction matrix of chromosome 5 at a resolution of 250 kb with Knight–Ruiz (KR) normalisation; upper right, naive PSCs; lower left, primed PSCs. Areas of contact enrichment were defined separately for naive and primed PSCs using HiCCUPS and each cell-type-specific set of chromatin interactions are highlighted as a black square on their respective heatmap. The two corner numbers indicate the maximum intensity values for the matrix. The tracks below the Hi-C heatmap show the PCHi-C interactions and CHiCAGO scores over the same region. f Heatmap shows the aggregate peak analysis (250 kb resolution) of all naive and primed chromatin interactions genome-wide for naive and primed PSCs. Chromatin interactions >5 Mb from the diagonal were used for the analysis. The ‘peak to lower left’ (P2LL) score denotes the enrichment of the central pixel over the pixels in the lower left quadrant.

