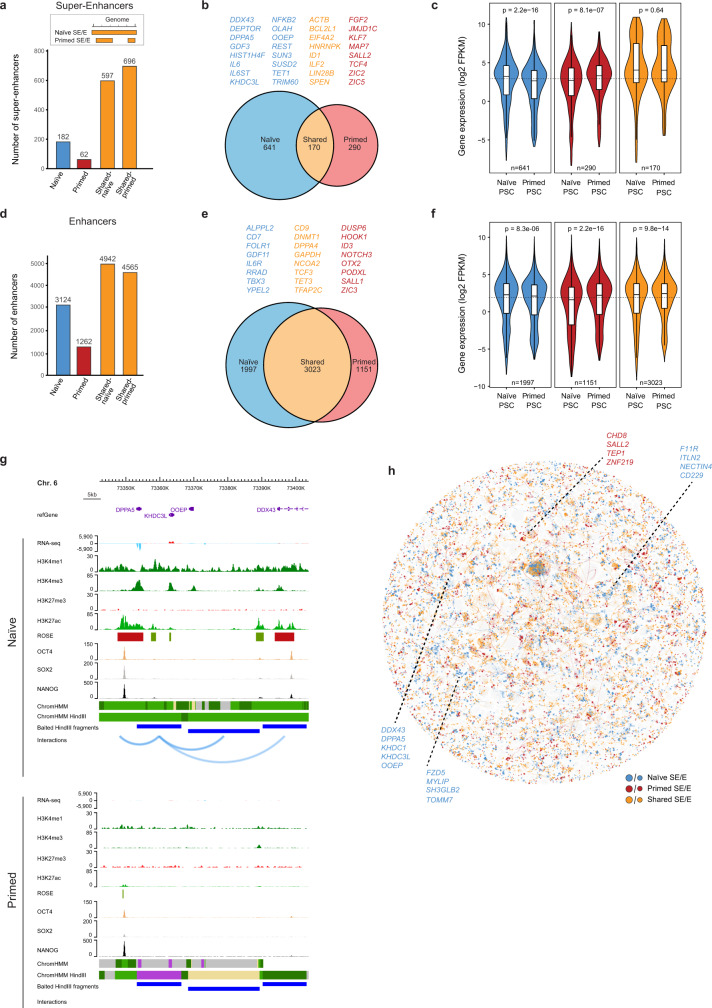
Fig. 4. Dynamics of enhancer activity and interactivity between human pluripotent states.
a Plot showing the number of ROSE-called SEs in naive and primed PSCs. As illustrated in the diagram, two values are given for shared SEs because a SE in one cell type may overlap with two individually called SEs in the other cell type. b Diagram showing the number of genes that are contacted by SEs in the two pluripotent cell types. Shared genes (orange) are genes that are contacted by SE elements in both naive and primed PSCs. Naive-specific genes (blue) and primed-specific genes (red) are contacted by SEs in either naive or primed PSCs, respectively. c Plots showing the log2 FPKM expression of genes that interact with SEs in each cell type (naive, n = 641 genes; primed, n = 290 genes; shared, n = 170 genes). The inner box bounds the IQR divided by the median (horizontal line), and Spear-style whiskers extend to the minimum and maximum of the data values. P-values are derived from a two-sided Mann–Whitney U test; n = 3 biologically independent RNA-seq datasets per cell type. d Plot showing the distribution of ROSE-called enhancers in naive and primed PSCs. e Diagram showing the number of genes that are contacted by enhancers in the two pluripotent cell types. Genes that are also in contact with a SE have been removed from this list of enhancer-interacting genes. f Plots showing the log2 FPKM expression of genes that interact with enhancer elements in each cell type (naive, n = 1997 genes; primed, n = 1151 genes; shared, n = 3023 genes). The inner box bounds the IQR divided by the median (horizontal line), and Spear-style whiskers extend to the minimum and maximum of the data values. P-values are derived from a two-sided Mann–Whitney U test; n = 3 biologically independent RNA-seq datasets per cell type. g Genome browser view of the DPPA5 promoter interactomes in naive (upper) and primed (lower) PSCs. Significant interactions are shown as blue arcs that connect the baited HindIII fragment containing the DPPA5 promoter with promoter-interacting regions. ChIP-seq (H3K4me1, H3K4me3, H3K27me3, H3K27ac, OCT4, SOX2 and NANOG) and strand-specific RNA-seq tracks are shown. Chromatin states include active chromatin, light green; H3K4me1-only chromatin, dark green; bivalent chromatin, purple; background, grey. ROSE tracks show the location of enhancers (green) and super-enhancers (red), and OSN tracks show the position of shared (orange) and naive-specific (blue) regions of OSN occupancy. h Network graph showing the locations and cell type-origin of enhancer and SE elements. Colours depict naive-specific (blue), primed-specific (red) and shared (orange) enhancer and SE elements. Node size represents SE (large nodes) and enhancers (small nodes). Lines represent interactions and are coloured according to the colour of the node of origin.

