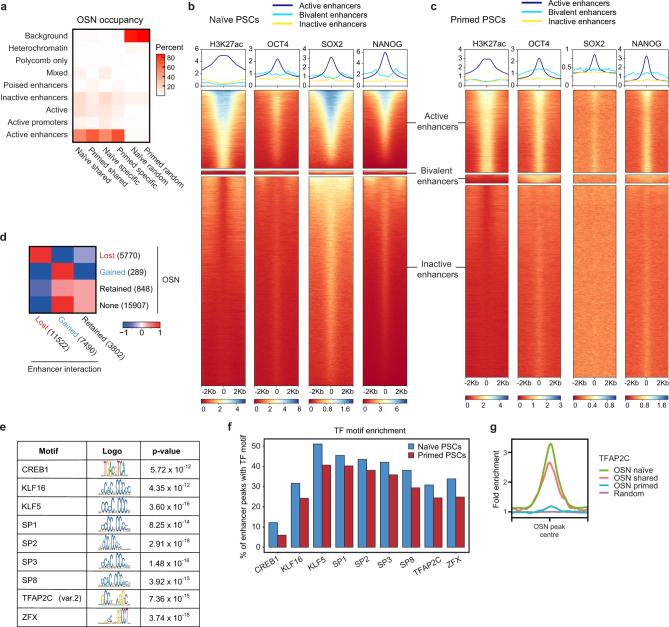
Fig. 6. Widespread reorganisation of OCT4, SOX2 and NANOG binding at enhancers occurs between human pluripotent states.
a Heatmap shows the percentage of OSN sites that fall within each of the ChromHMM-defined chromatin states. Columns 1 and 2 indicate OSN sites that are common to both naive and primed PSCs; columns 3 and 4 are OSN sites that are specific to either naive or primed PSCs; columns 5 and 6 represent random regions that do not contain OSN sites. b, c ChIP-seq data for H3K27ac, OCT4, SOX2 and NANOG in b naive and c primed PSCs. Metaplots (upper) and heatmaps (lower) show normalised ChIP-seq read counts within a 4 kb peak-centred window. Regions were subsetted into active enhancers (naive, n = 43,966; primed, n = 54,633), bivalent enhancers (naive, n = 1,998; primed, n = 5,502) and inactive enhancers (naive, n = 117,609; primed, n = 127,146) based on ChromHMM-defined chromatin states, and ranked by H3K27ac signal. d Heatmap shows the log2 odds ratio for the associated changes in OSN occupancy and promoter–enhancer interactions in primed compared to naive PSCs. e Table shows the highest-ranking (by adjusted P-value, one-tailed Fisher’s exact test) transcription factor motifs that are enriched at OSN sites in naive compared to primed PSCs. Four motifs associated with transcription factors that are not expressed in naive PSCs (log2 RPKM < 0) were removed from the list: KLF1, NR2F1, ZNF354C and VDR. f Bar chart shows the percentage of OSN-bound enhancers that contain each of the identified transcription factor motifs in naive and primed PSCs. g Enrichment of TFAP2C ChIP-seq signal across OSN peaks and the 2 kb up- and downstream regions.

