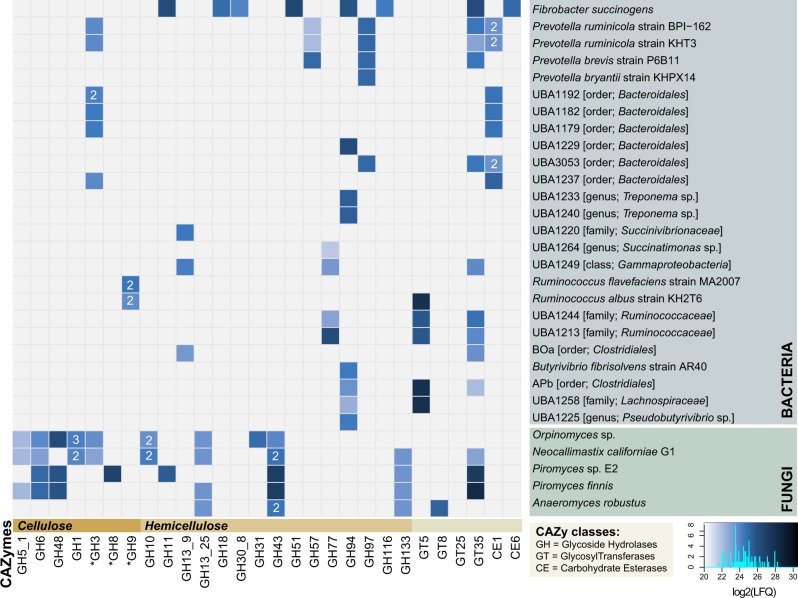
Fig. 2. CAZyme profile from each predicted source organism in RUS-refDB, displaying the detected proteins associated with the milled switchgrass.
Here, we focused only on CAZymes detected in both animals to achieve high confidence detection of the active key populations. CAZy families that might possess activity against cellulose and hemicellulose are indicated with an asterisk. The colors in the heat map indicates the protein detection levels of each protein group reported as the average Log2(LFQ)-scores for the biological replicates, where a light blue color is low detection while darker is high protein detection. Some of the source organisms encompassed more than one detected variant of GH1, GH3, GH43, and CE1. For these cases, the protein detection is reported as the average Log2(LFQ)-score and number of variants are indicated within the heat map. A corresponding figure showing the detection level for all variants separately, as well as the detection in the rumen fluid microhabitat is provided in Supplementary Fig. S3.

