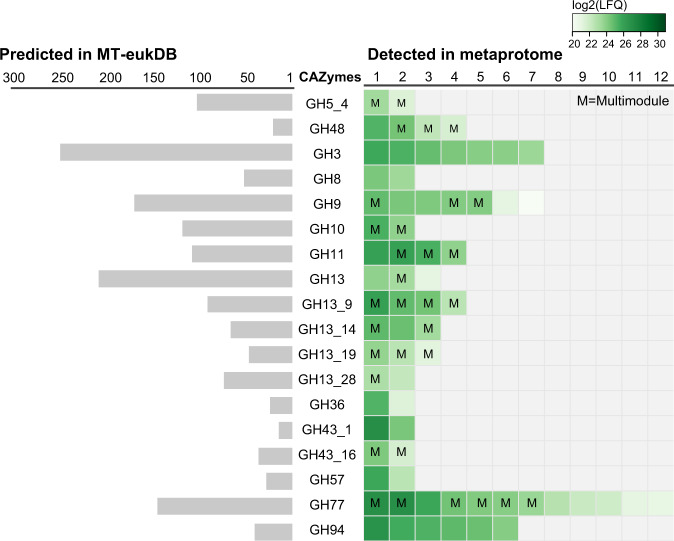
Fig. 3. Visualization of the number of predicted genes annotated to specific GH families in MT-eukDB (left) and those detected when searching MT-eukDB against the metaproteome (right).
Only CAZymes detected in both animals in at least one of the microhabitats are included to achieve high confidence detection. The colors of the squares in the right panel indicates the protein detection level for each individual protein, reported as the average log2(LFQ) of the biological replicates, where light green represents low detection level while darker green is high protein detection level. While this figure only shows those detected in the milled switchgrass, a comprehensive table of all CAZymes detected in both switchgrass and rumen fluid can be found in Supplementary Data S3. This also includes details regarding proteins with multiple CAZyme modules (indicated with an ‘M’).

