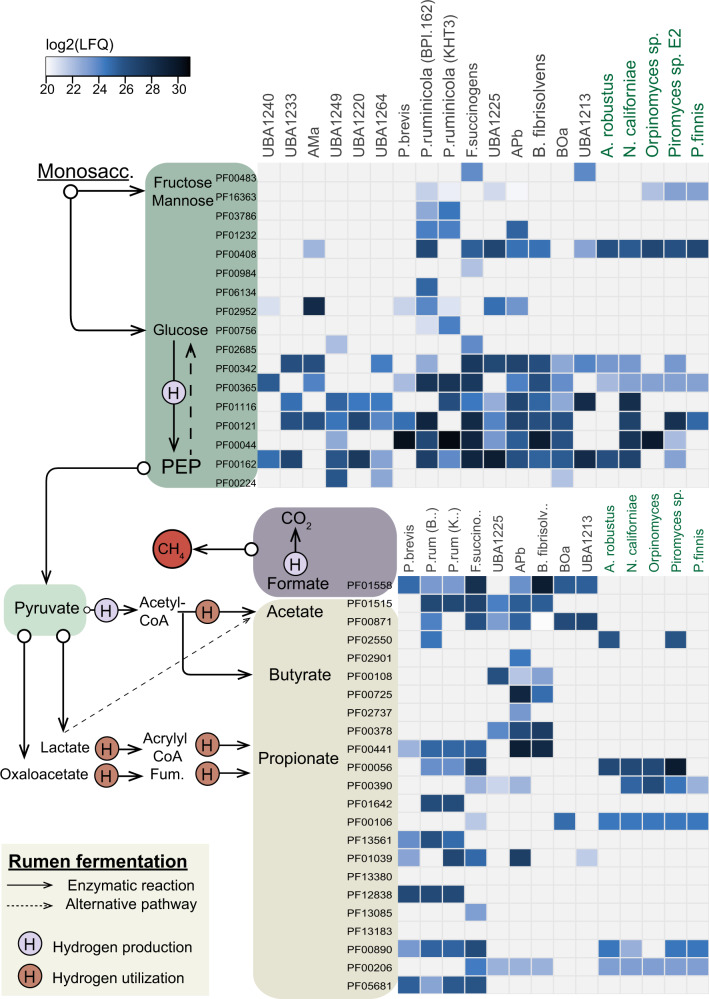
Fig. 4. Metabolic reconstruction of key players intermediate rumen fermentation as determined in this study.
The heat map shows the detection of proteins associated to main metabolic pathways (listed as pfam IDs) found in the most active genomes/MAGs (indicated on the top: Anasp Anaeromyces robustus, Pirfi Piromyces finnis, PirE2 Piromyces sp. E2, Neosp Neocallimastix californiae, Orpsp Orpinomyces sp.) in RUS-refDB. The colors in the heat map indicates the protein detection levels reported as the average log2(LFQ)-scores for each biological replicate, where light blue represent lower detection levels while darker blue is high protein detection. Only the proteins from the switchgrass are included in the current figure, while a corresponding figure including protein detection from both switchgrass and rumen fluid is available in Supplementary Fig. S4. A comprehensive table including proteins detected in all MAGs/genomes included in RUS-refDB, proteins associated to the rumen fluid and the functional categorization of the pfam IDs can be found in Supplementary Data S2.

