
Figure 5. ATLD cells show elevated PARylation, single-strand DNA breaks and protein aggregation similar to ATM oxidation-deficient cells.
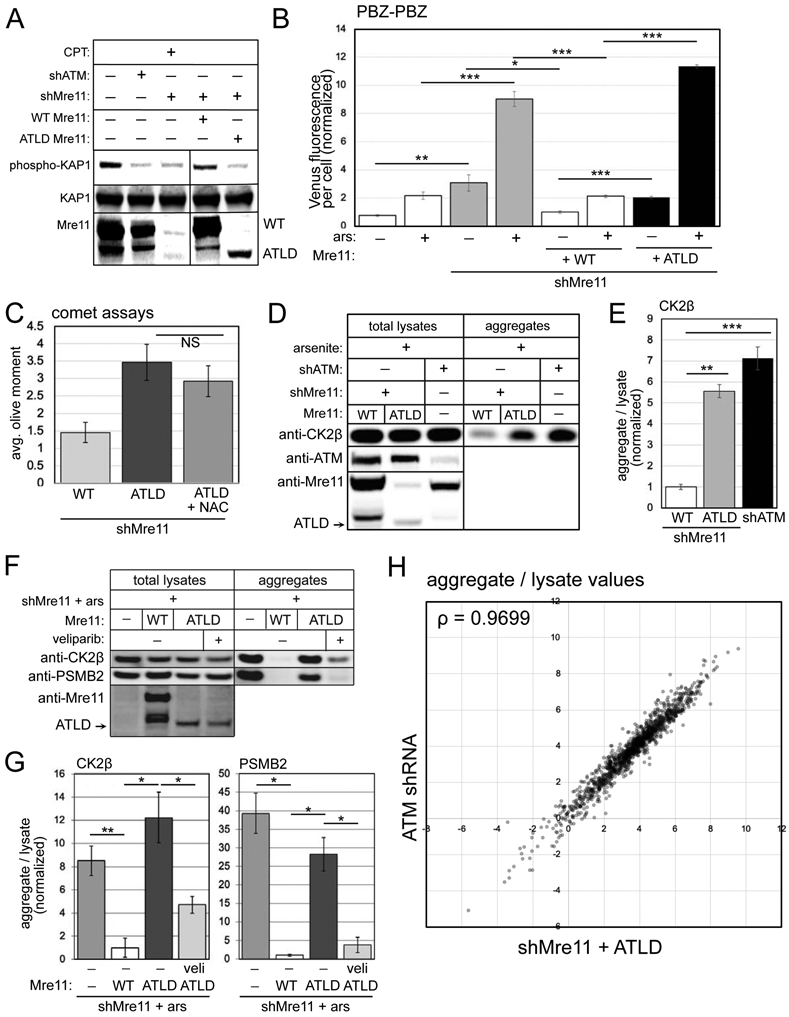
(A) shRNA depletion of Mre11 in U2OS cells with WT or ATLD3/4 expression, as indicated. Cells were exposed to camptothecin (10 μM, 1 hour) and blotted for phospho-S824 Kap1, total Kap1, and Mre11. (B) Fluorescence yield from the PBZ-PBZ PAR sensor measured in triplicate as in Fig. 2B in U2OS cells with Mre11 depletion, expression of WT or ATLD Mre11, and arsenite (25 μM) as indicated. Error bars indicate standard deviation. (C) Alkaline comet assays as in Fig. 1 with Mre11 shRNA depletion and expression of ATLD Mre11 with NAC as indicated; error bars represent SEM. (D) Aggregation assays as in Fig. 1 with Mre11 shRNA and WT or ATLD Mre11 expression compared to ATM shRNA treatment as indicated. Total lysates and aggregates analyzed by western blot for ATM, Mre11, and CK2β. (E) Three replicates of (D) were quantified; levels of CK2β and PSMB2 in aggregate fractions normalized by lysate levels are shown relative to cells expressing WT Mre11. (F) Aggregation assays as in Fig. 1 with Mre11 shRNA and either WT or ATLD Mre11 expression, veliparib added as indicated (10 μM). Lysates and aggregate fractions analyzed by western blot for Mre11, CK2β, and PSMB2. (G) Three replicates of (F) were quantified; levels of CK2β and PSMB2 in aggregate fractions normalized by lysate levels shown relative to cells expressing WT Mre11. Error bars indicate standard deviation. *, **, ***, and **** indicate p<0.05, 0.005, and 0.0005 by Student two-tailed t-test; NS = not significant. (H) Aggregates and total lysates from 3 replicates of (D) were analyzed by mass spectrometry. Aggregate values (normalized by lysate) for each protein (mean of 3 replicates) were plotted: Mre11-depleted cells with ATLD expression (X axis) versus ATM-treated cells (Y axis); Spearman correlation coefficient = 0.9699.