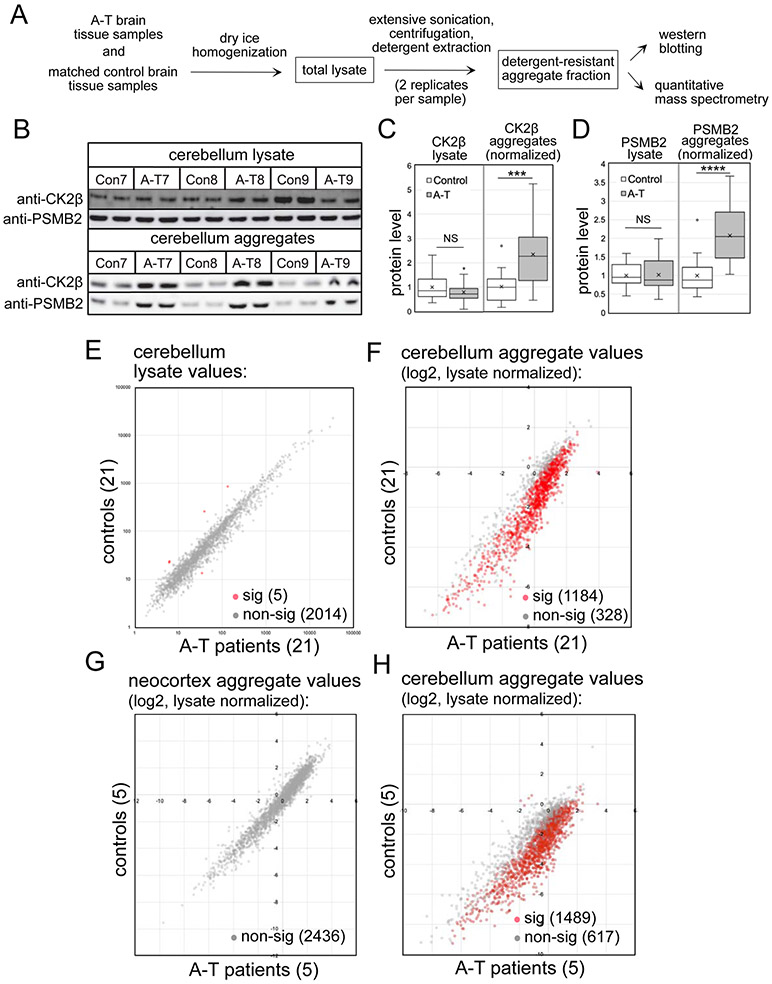
Figure 6. Global proteomics analysis of A-T patient cerebellum tissues and age-matched controls shows widespread protein aggregation.
(A) Diagram of brain tissue workflow (see methods). (B) Representative western blot showing CK2β and PSMB2 levels in cerebellum lysates and aggregate fractions. (C, D) Quantification of western blotting from 42 lysates (replicates averaged) and 42 aggregate samples (normalized by lysate amounts), with all values normalized to control group. Error bars indicate standard deviation. *, **, ***, and **** indicate p<0.05, 0.005, and 0.0005 by Student two-tailed t-test; NS = not significant. (E). Levels of 2019 proteins found in the cerebellum lysates of control and A-T patient samples by mass spectrometry. Red indicates proteins with significant differences between patient and control groups; grey indicates non-significant differences. (F) Cerebellum aggregate levels from 1512 proteins quantitated in A-T patients relative to controls, normalized by lysate levels. Red/grey indicators as in (E). (G) Neocortex aggregate levels (normalized by lysate values) for 2436 polypeptides from 5 A-T patients and age-matched controls (#1, 4, 7, 10, 11); Red/grey indicators as in (E). (H) Cerebellum aggregate levels (normalized by lysate values) for 2106 polypeptides from 5 A-T patients and age-matched controls (#1, 4, 7, 10, 11). Red/grey indicators as in (E). Significance was determined by Benjamini-Hochberg with FDR 0.05 for the analysis of 21 pairs (E,F) and 0.1 for the analysis of 5 pairs (G,H).

