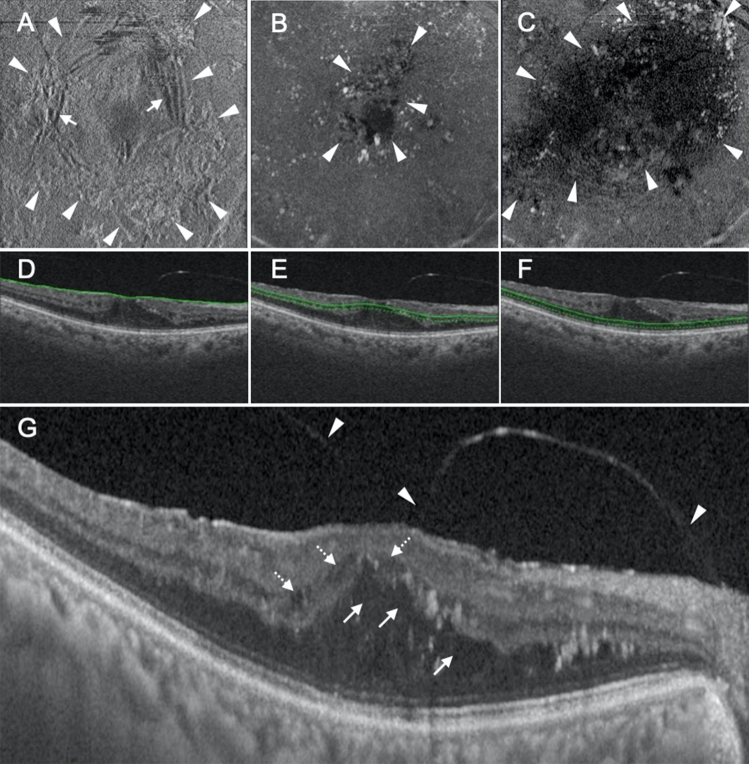
Figure 3.
Representative case showing the parafoveal cystoid space at Segment 1/diffuse fluid at Segment 2 type of diabetic macular edema. (A–C) En face images of the retinal surface (A), Segment 1 (B), and Segment 2 (C) are presented. Epiretinal membrane (arrowheads in A) and associated retinal folds (arrows in A) can be observed at the surface of the retina (A). There are cystoid spaces at Segment 1, with the area of fluid remaining within the parafovea (arrowheads in B). Segment 2 shows diffuse fluid (arrowheads in C). (D–F) B-scan images and the green lines show the locations at which the en face images of the retinal surface (D), Segment 1 (E), and Segment 2 (F) were generated. The scan depth, indicated by the distance between the green line and green dotted line, was set to 0 μm for the en face image of the retinal surface (D) and 50 μm for the en face images of both Segments 1 and 2 (E,F, respectively). (G) A horizontal B-scan image centered at the fovea is presented. There are parafoveal cystoid spaces at both Henle’s fiber layer (arrows in G) and the inner nuclear layer (dotted arrows in G). The fluid at Segment 2 observed on the en face image is not clearly visualized on this cross-sectional image. The arrowheads in (G) show incomplete posterior vitreous detachment.

