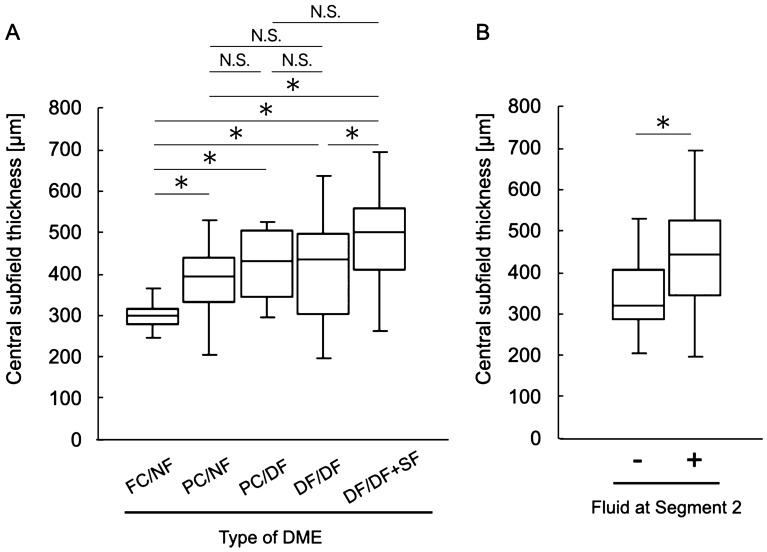
Figure 8.
Relationship between the central subfield thickness (CST) and the en face image-based classification of diabetic macular edema (DME). (A) CST values are compared among the DME types. (B) CST values compared according to the presence or absence of fluid at Segment 2. DME diabetic macular edema, FC/NF foveal cystoid space/no fluid type, PC/NF parafoveal cystoid space/no fluid type, PC/DF parafoveal cystoid space/diffuse fluid type, DF/DF diffuse fluid/diffuse fluid type, DF/DF + SF diffuse fluid/diffuse fluid with subretinal fluid type, N.S. not significant, *P < 0.001.

