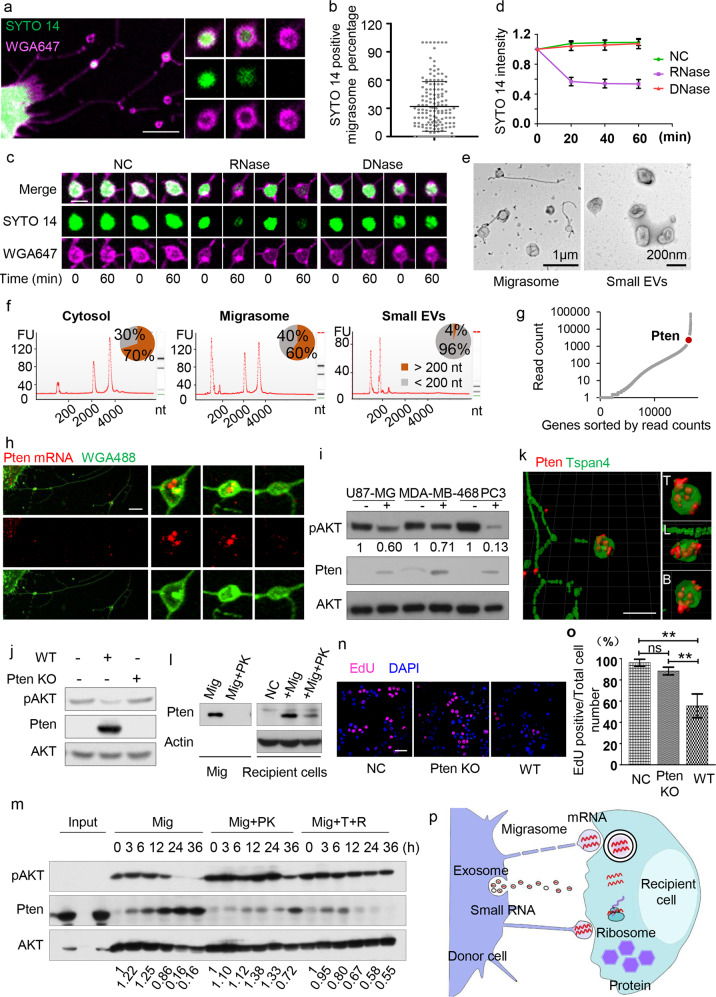
Fig. 1. Lateral transfer of mRNA and protein by migrasomes modifies the recipient cells.
a Representative image of an L929 cell stained with SYTO 14 and WGA 647. Scale bar, 10 μm. b The percentage of SYTO 14-positive migrasomes was quantified in L929 cells (n = 150 cells from three independent experiments). Data are presented as means ± SD. c Representative images of SYTO 14-positive migrasomes treated with PBS (negative control, NC), 10 µg/mL RNase, or 30 u/mL RNase-free DNase for 60 min. Scale bar, 2 μm. d Quantification of SYTO 14 mean intensity in migrasomes before and after enzyme treatment (n = 90 migrasomes from three independent experiments). Data are presented as means ± SD. For NC and DNase treatment, P = 0.5080; for NC and RNase treatment, P < 0.0001. e TEM images of purified migrasomes and small EVs. f Electropherograms of total RNA isolated from the cytosol, migrasome and small EV fractions of mouse L929 cells. Size distributions of the RNAs are shown on the electropherogram traces (red lines), and the percentages of long (> 200 nt) and short (< 200 nt) RNA species are shown as pie charts. g All genes with at least one read in the migrasome RNA-seq dataset are sorted, from left to right, by their read counts (shown on the Y-axis). Pten is highlighted on the dot plot. h Detection of Pten mRNA localization in migrasomes. Scale bar, 5 μm. i Purified migrasomes (8 μg) were incubated with U87-MG, MDA-MB-468, and PC3 cells for 24 h, respectively. Protein levels were assessed by western blotting. j Migrasomes (8 μg) were purified from WT or Pten KO L929 cells and incubated with MDA-MB-468 cells for 24 h. pAKT and Pten levels were analyzed by western blotting. k Representative images of WT L929 cells stained with antibody against Pten and imaged by SIM microscopy. Scale bar, 5 μm. l Left panel: Purified migrasomes (10 μg) were treated without (Mig) or with (Mig+PK) 50 μg/mL Proteinase K for 30 min, then analyzed by western blotting for the presence of Pten. Right panel: Purified migrasomes (10 μg) treated with or without 50 μg/mL Proteinase K for 30 min were incubated with MDA-MB-468 cells for 24 h. Cellular Pten levels were assessed by western blotting. NC, negative control (untreated cells). m Purified migrasomes (20 μg) were treated with 50 μg/mL Proteinase K (Mig+PK) or 10 μg/mL RNase plus 0.1% Triton X-100 (Mig+T+R), and incubated with MDA-MB-468 cells for 3, 6, 12, 24, and 36 h. Protein levels were assessed by western blotting. n Representative images of EdU incorporation in MDA-MB-468 cells treated for 18 h with PBS (NC), migrasomes (8 μg) isolated from wild-type cells (WT) or migrasomes (8 μg) isolated from Pten KO cells (Pten KO). o The percentage of EdU-positive cells was measured and normalized to control cells (n = 3 independent experiments). Data are presented as means ± SD. p Model of mRNA transfer by migrasomes.

