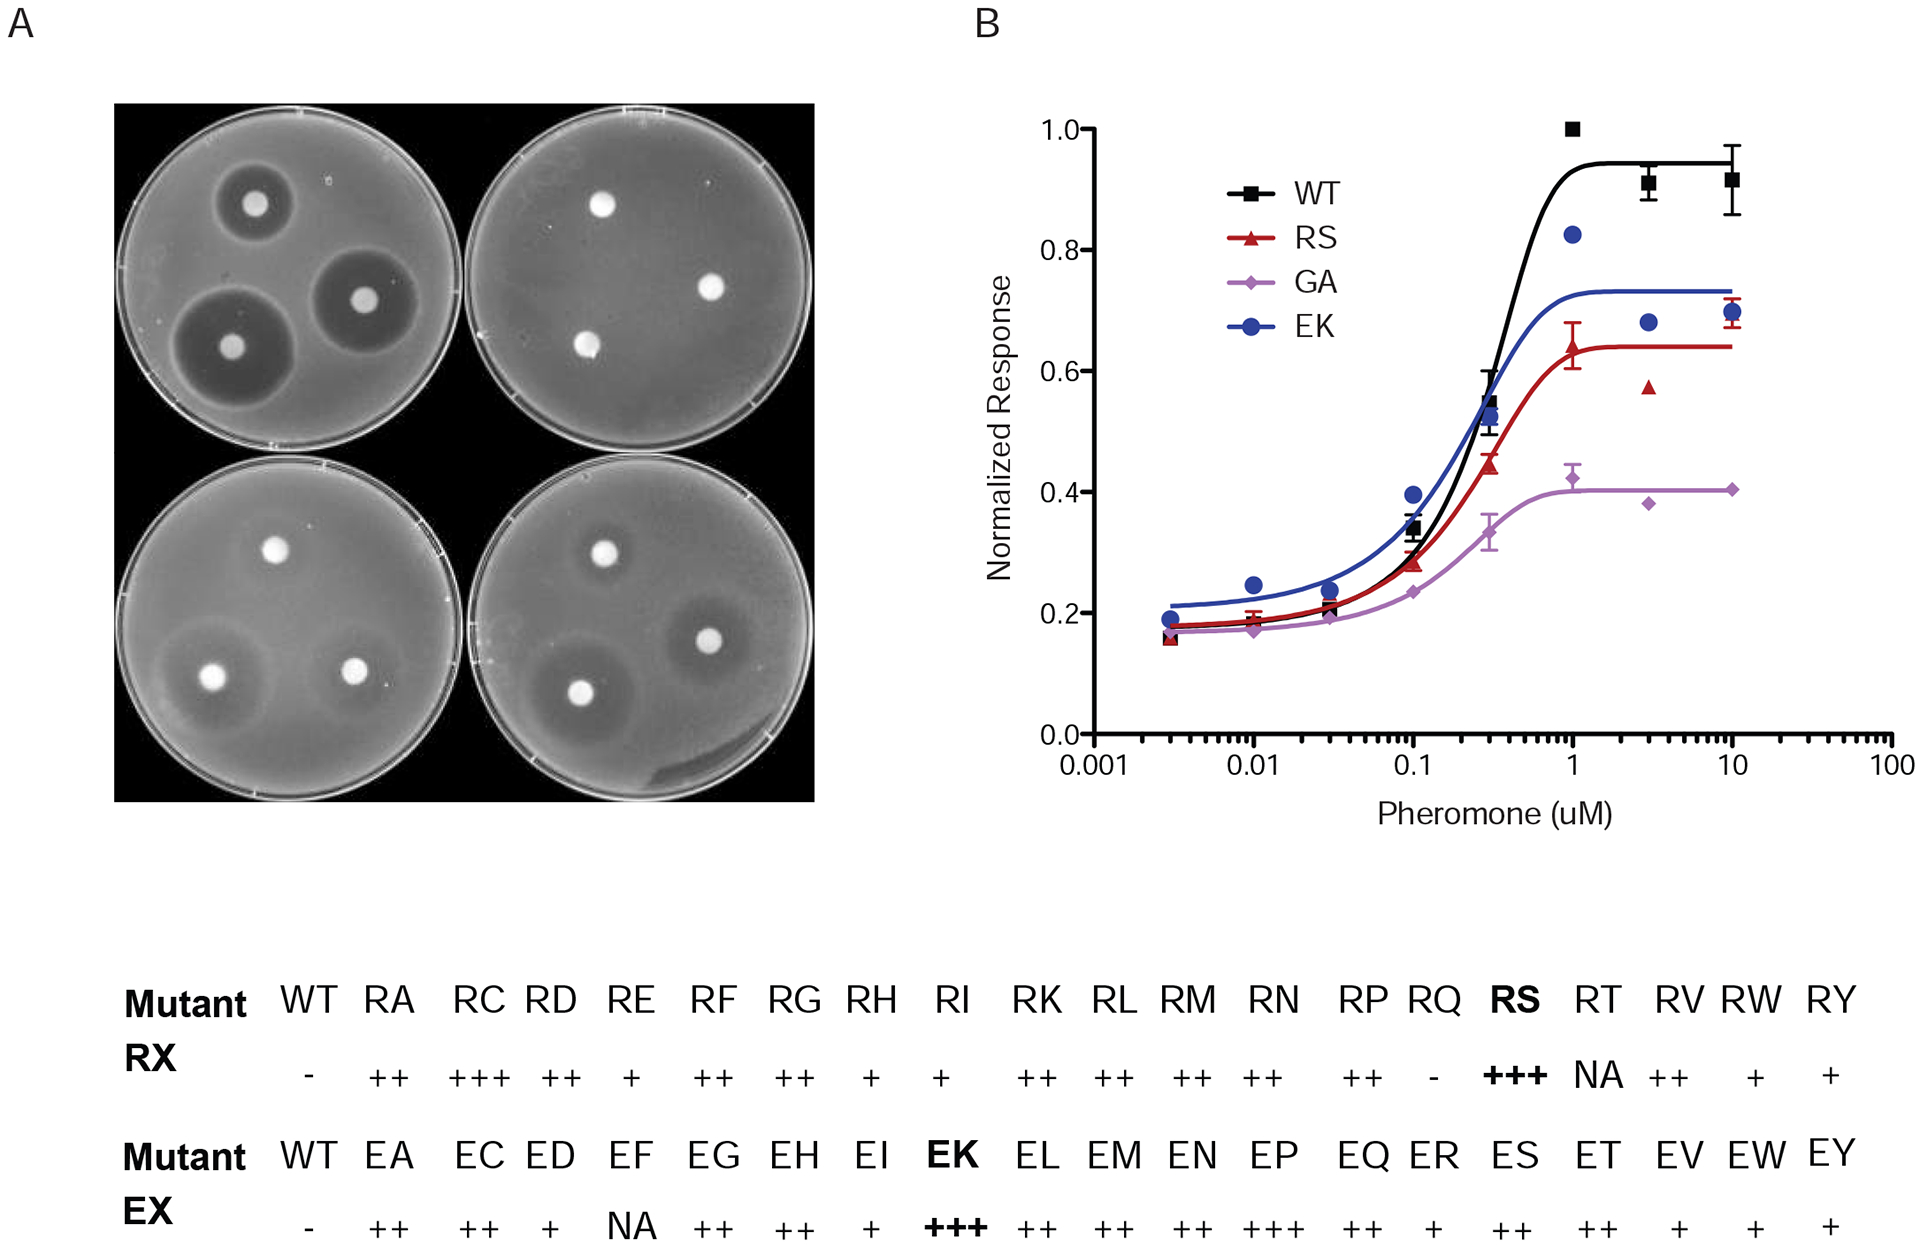
Figure 2. Triad residues regulate Gβγ signaling in vivo.

Wild-type yeast cells transformed with a single copy plasmid containing GPA1 or the indicated mutant G322A (GA), R327S (RS) or E364K (EK).
Left, plate assay with filter disks containing 75, 25, or 8 μg α-factor pheromone.
Right, transcription reporter assay after treatment with the indicated concentration of α factor pheromone. Data are averages of three independent experiments (+/−SE).
Bottom, quantitation of mutant phenotypes. Values indicate extent of growth inhibition, ranging from least (−) to most (+++) turbidity.
See also Figure S2
