
Figure 2. Characterization of the 15 gene coexpression networks in ccRCC and association with survival endpoints.
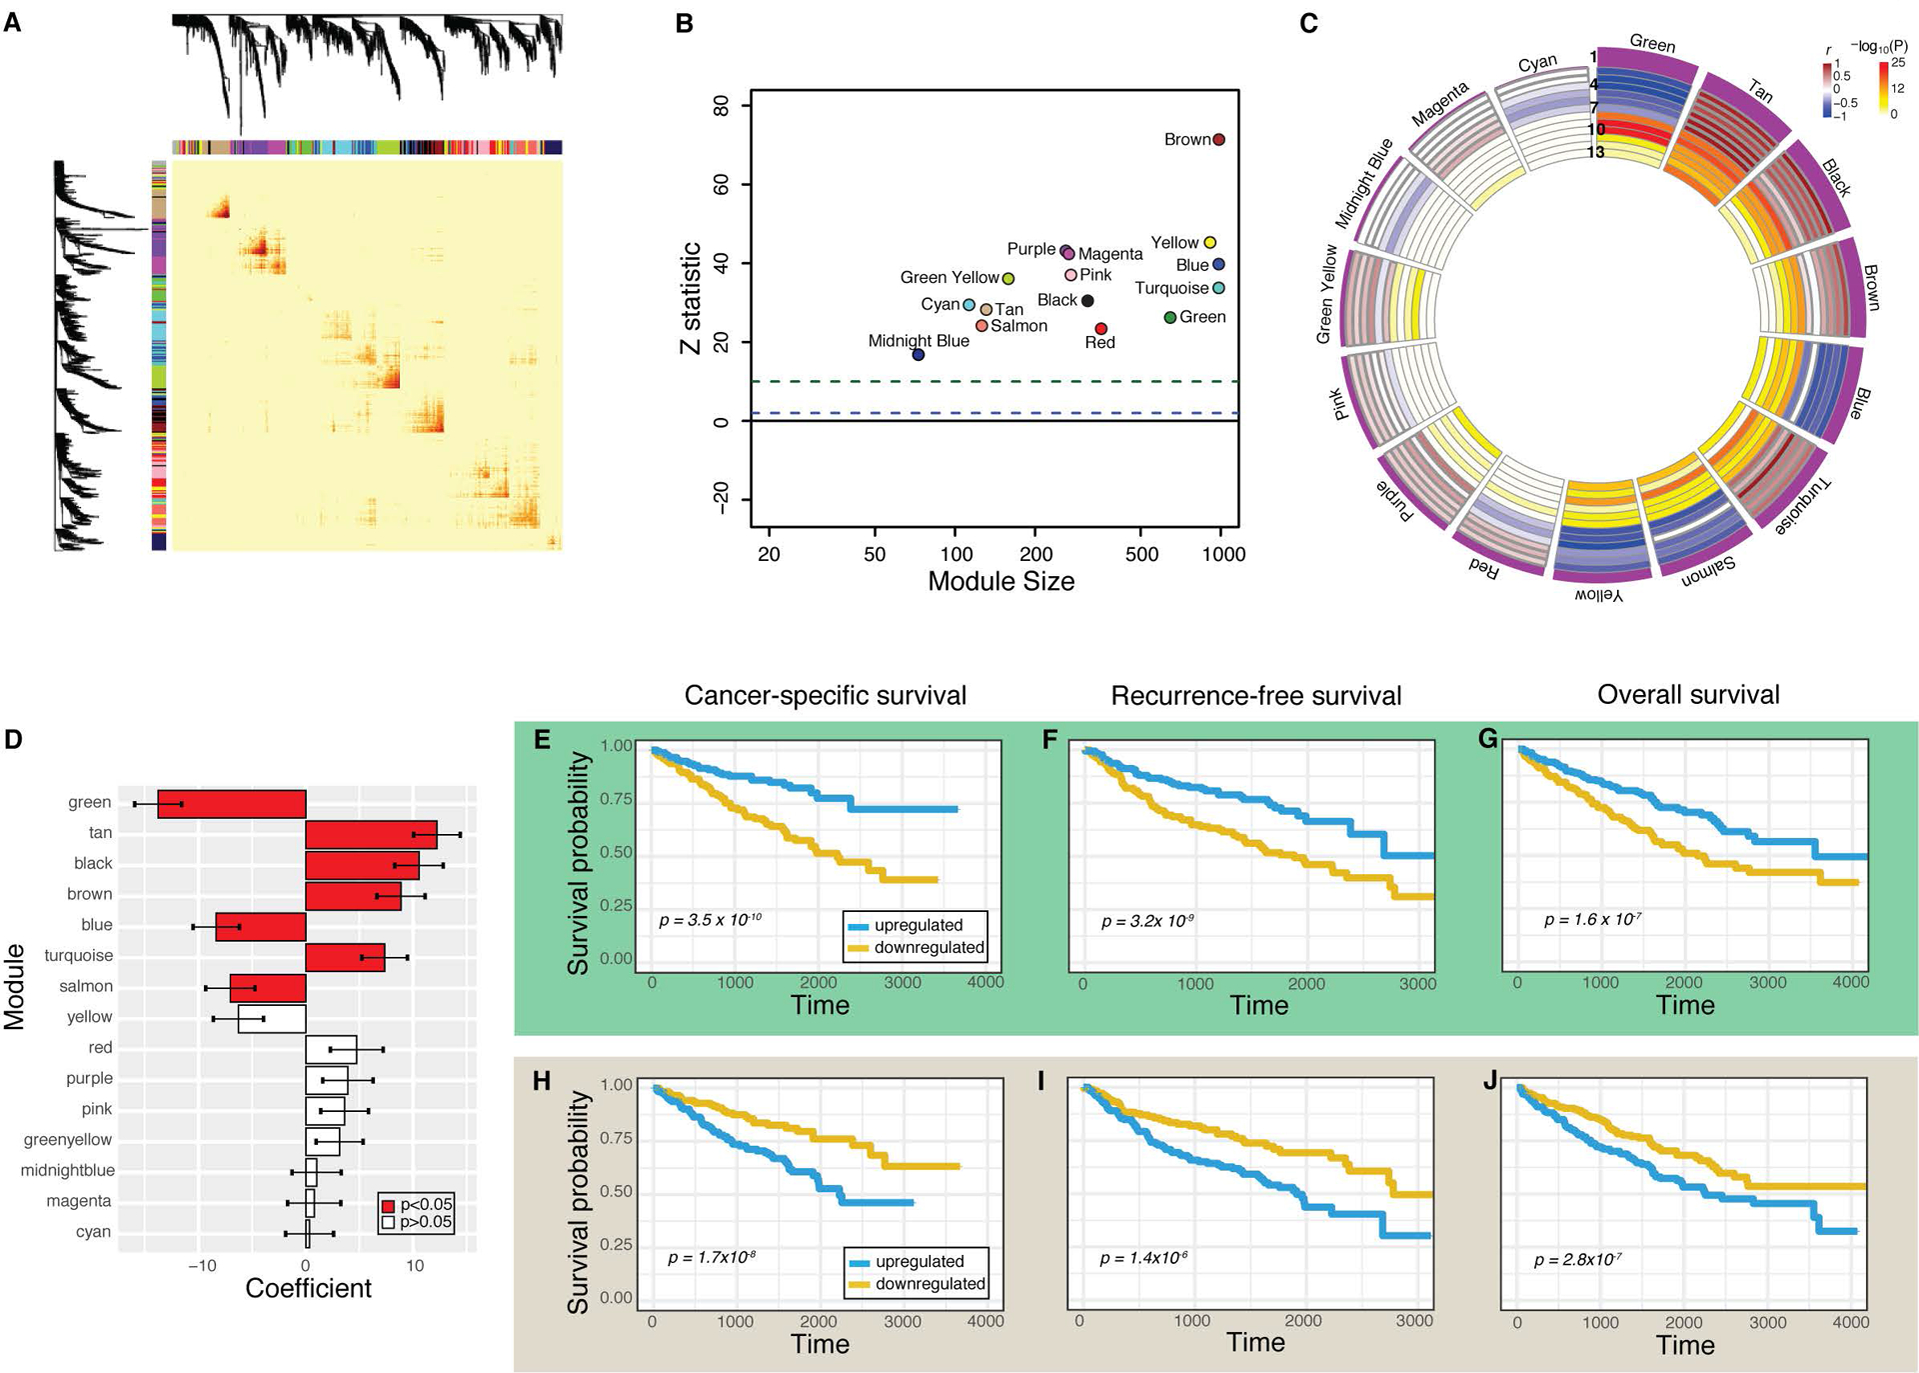
(A) Topological overlap matrix plot depicts gene coexpression. Darker yellow and red represents stronger correlations between genes. (B) Z statistic represents reproducibility of each module. Z > 10 (green dotted line) represents strong evidence of robustness and Z >1 (blue dotted line) represents weak evidence. (C) Circos plot depicts module eigengene correlations with survival and pathology measurements. Modules are ranked by the strength of their association with cancer-specific survival, reflected by the height of the purple histogram in Row 1. Rows 2–4 reflect the Cox model beta coefficient for overall survival, cancer-specific survival, and recurrence-free survival, respectively. Rows 5–7 reflect rho values for T, N, and M stage, respectively. Bluer values reflect negative values, while brown values reflect strong positive values. Rows 8–13 depict the −log10(P) values for the same survival (8–10) and pathology variables (11–13). (D) Cox model beta coefficient and 95% confidence interval for each module and its association with cancer-specific survival. Red bars depict P < 0.05. (E-J) Survival curves comparing individuals with upregulated (blue) and downregulated (gold) network expression for green module (E-G) and tan module (H-J). Cancer-specific survival (E,H), recurrence-free survival (F, I), and overall survival (G,J) are depicted, and their respective Cox P values are each less than 0.05.