Fig. 3.
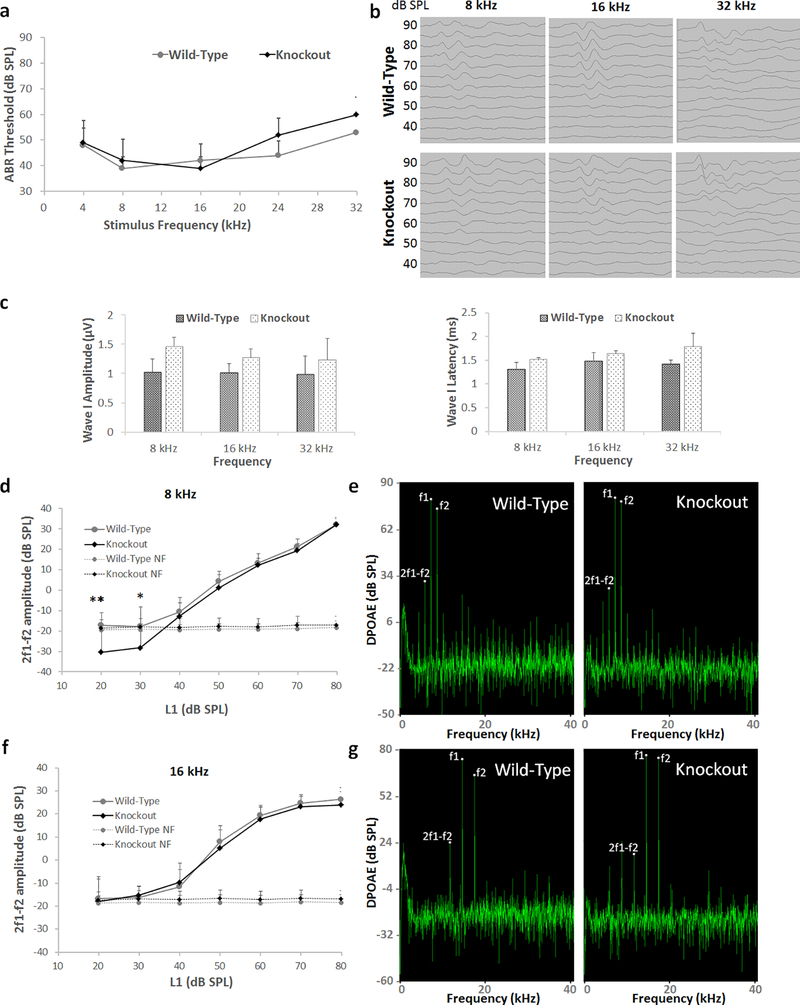
Auditory brainstem responses and distortion product otoacoustic emissions of Lmo4 conditional knockout mice. a) ABR thresholds of 6-week old mice, measured at 4, 8, 16, 24, and 32 kHz, indicated that the hearing thresholds of knockout mice are similar to that of wild-type mice across all the frequencies. The results are expressed as mean ± standard deviation, n = 5–6. b) Representative ABR waveform in response to stimuli at 8, 16, and 32 kHz is illustrated. c) Measurement of the amplitudes and latencies of wave I for 90 dB stimuli at 8, 16 and 32 kHz indicated that the ABR wave pattern is also similar in both knockout and wild-type mi,ce. The results are expressed as mean ± standard error mean, n = 6–12. d) DPOAE amplitudes of 6-week old mice, measured at 8 kHz, indicated that the otoacoustic emissions of knockout mice are largely similar to that of wild-type mice except for the DPOAEs recorded with 40 and 20 dB L1, which were below the noise floor. The results are expressed as mean ± standard deviation, n = 6–7 (*p<0.05, **p<0.01). e) Representative DPOAE waveform in response to stimuli at 8 kHz is illustrated. f) DPOAE amplitudes measured at 16 kHz also indicated that the otoacoustic emissions of knockout mice are similar to that of wild-type mice. The results are expressed as mean ± standard deviation, n = 6–7. g) Representative DPOAE waveform in response to stimuli at 16 kHz is illustrated.

