
Figure 2. Immune composition and spatial distribution in DCIS and IDC.
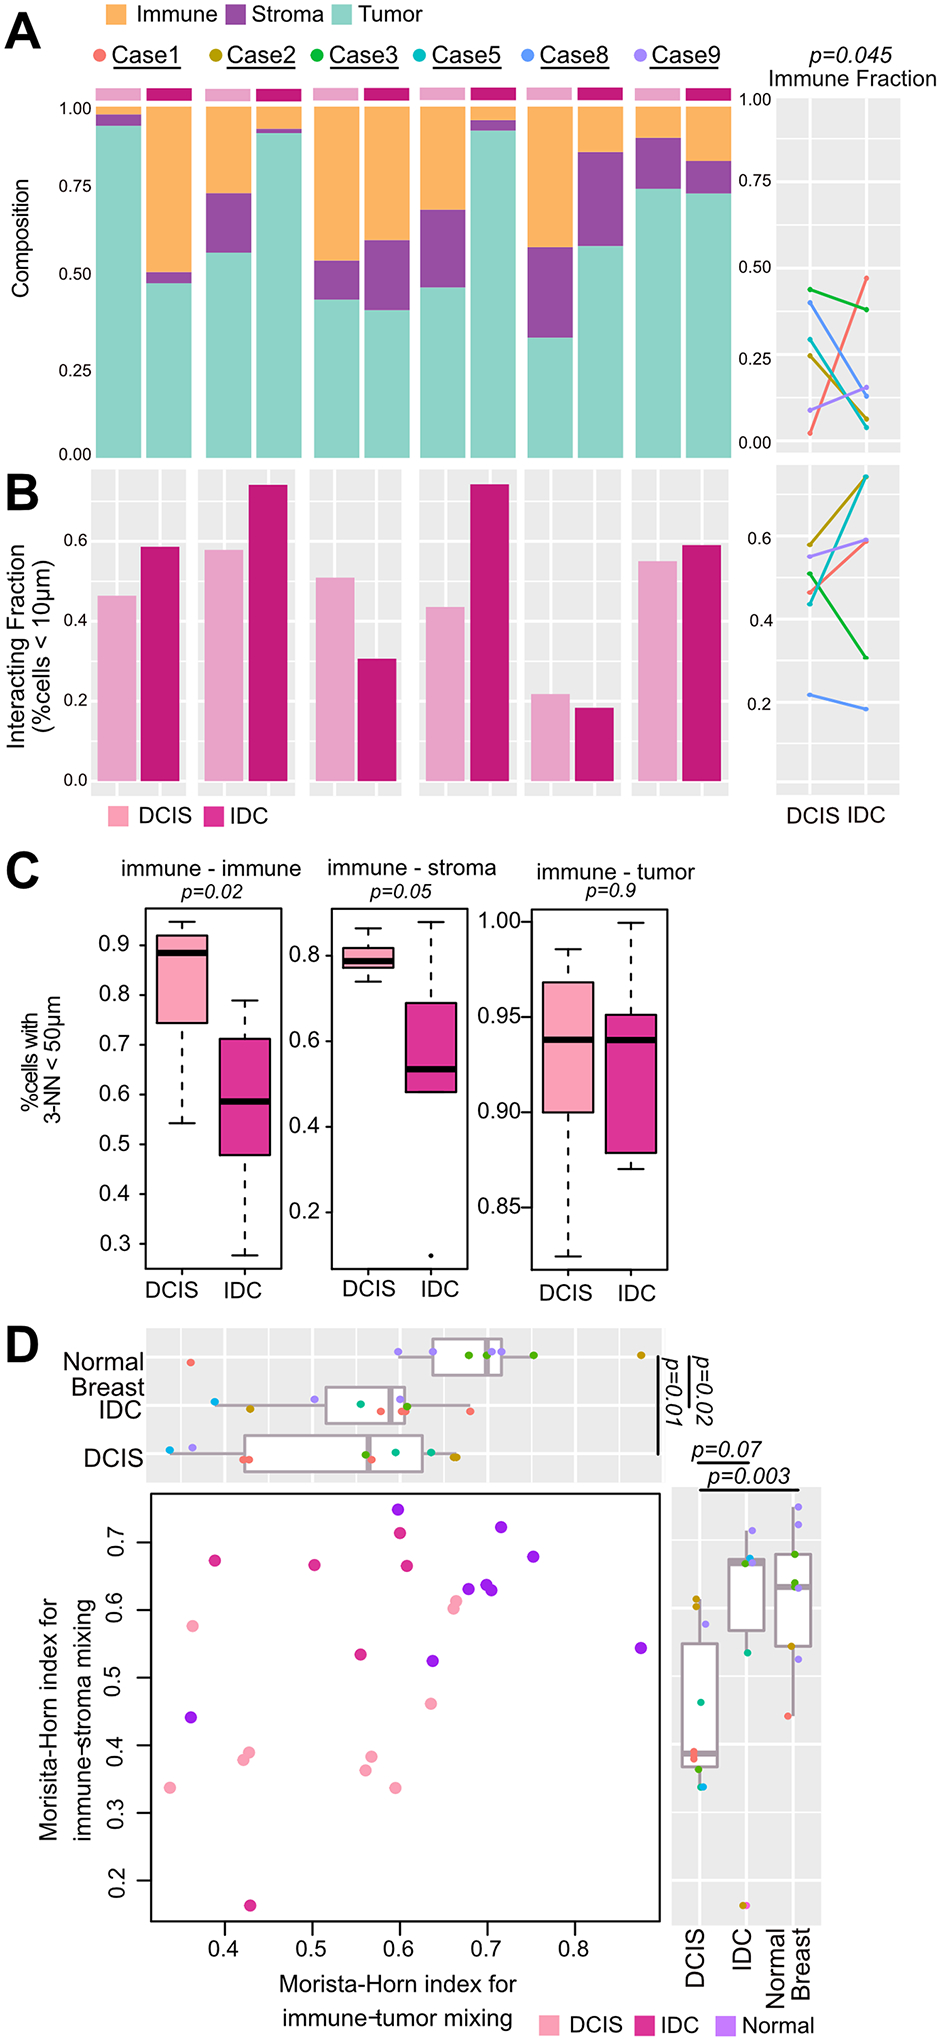
A-C, Compositional and spatial features in the recurrence set based on whole slide H&E images. A, Cellular composition. Significance computed using a beta-regression for bounded fractions (P=0.009) and by paired one-tailed t-test (P=0.045). B, Proportion of immune cells within 10μm of an epithelial cell within digitally macrodissected DCIS, IDC or normal regions. C, Proportion of cells with k-Nearest neighbor (k=3) distances less than 50μm. Significance computed using Wilcoxon rank sum test and beta-regression for bounded fractions (PImmune-Immune=0.003, PImmune-Stroma=0.02). D, Morisita-Horn index of tumor-lymphocyte and stroma-lymphocyte mixing in digitally macrodissected DCIS, IDC or normal regions. Significance between groups computed using Wilcoxon rank sum test.