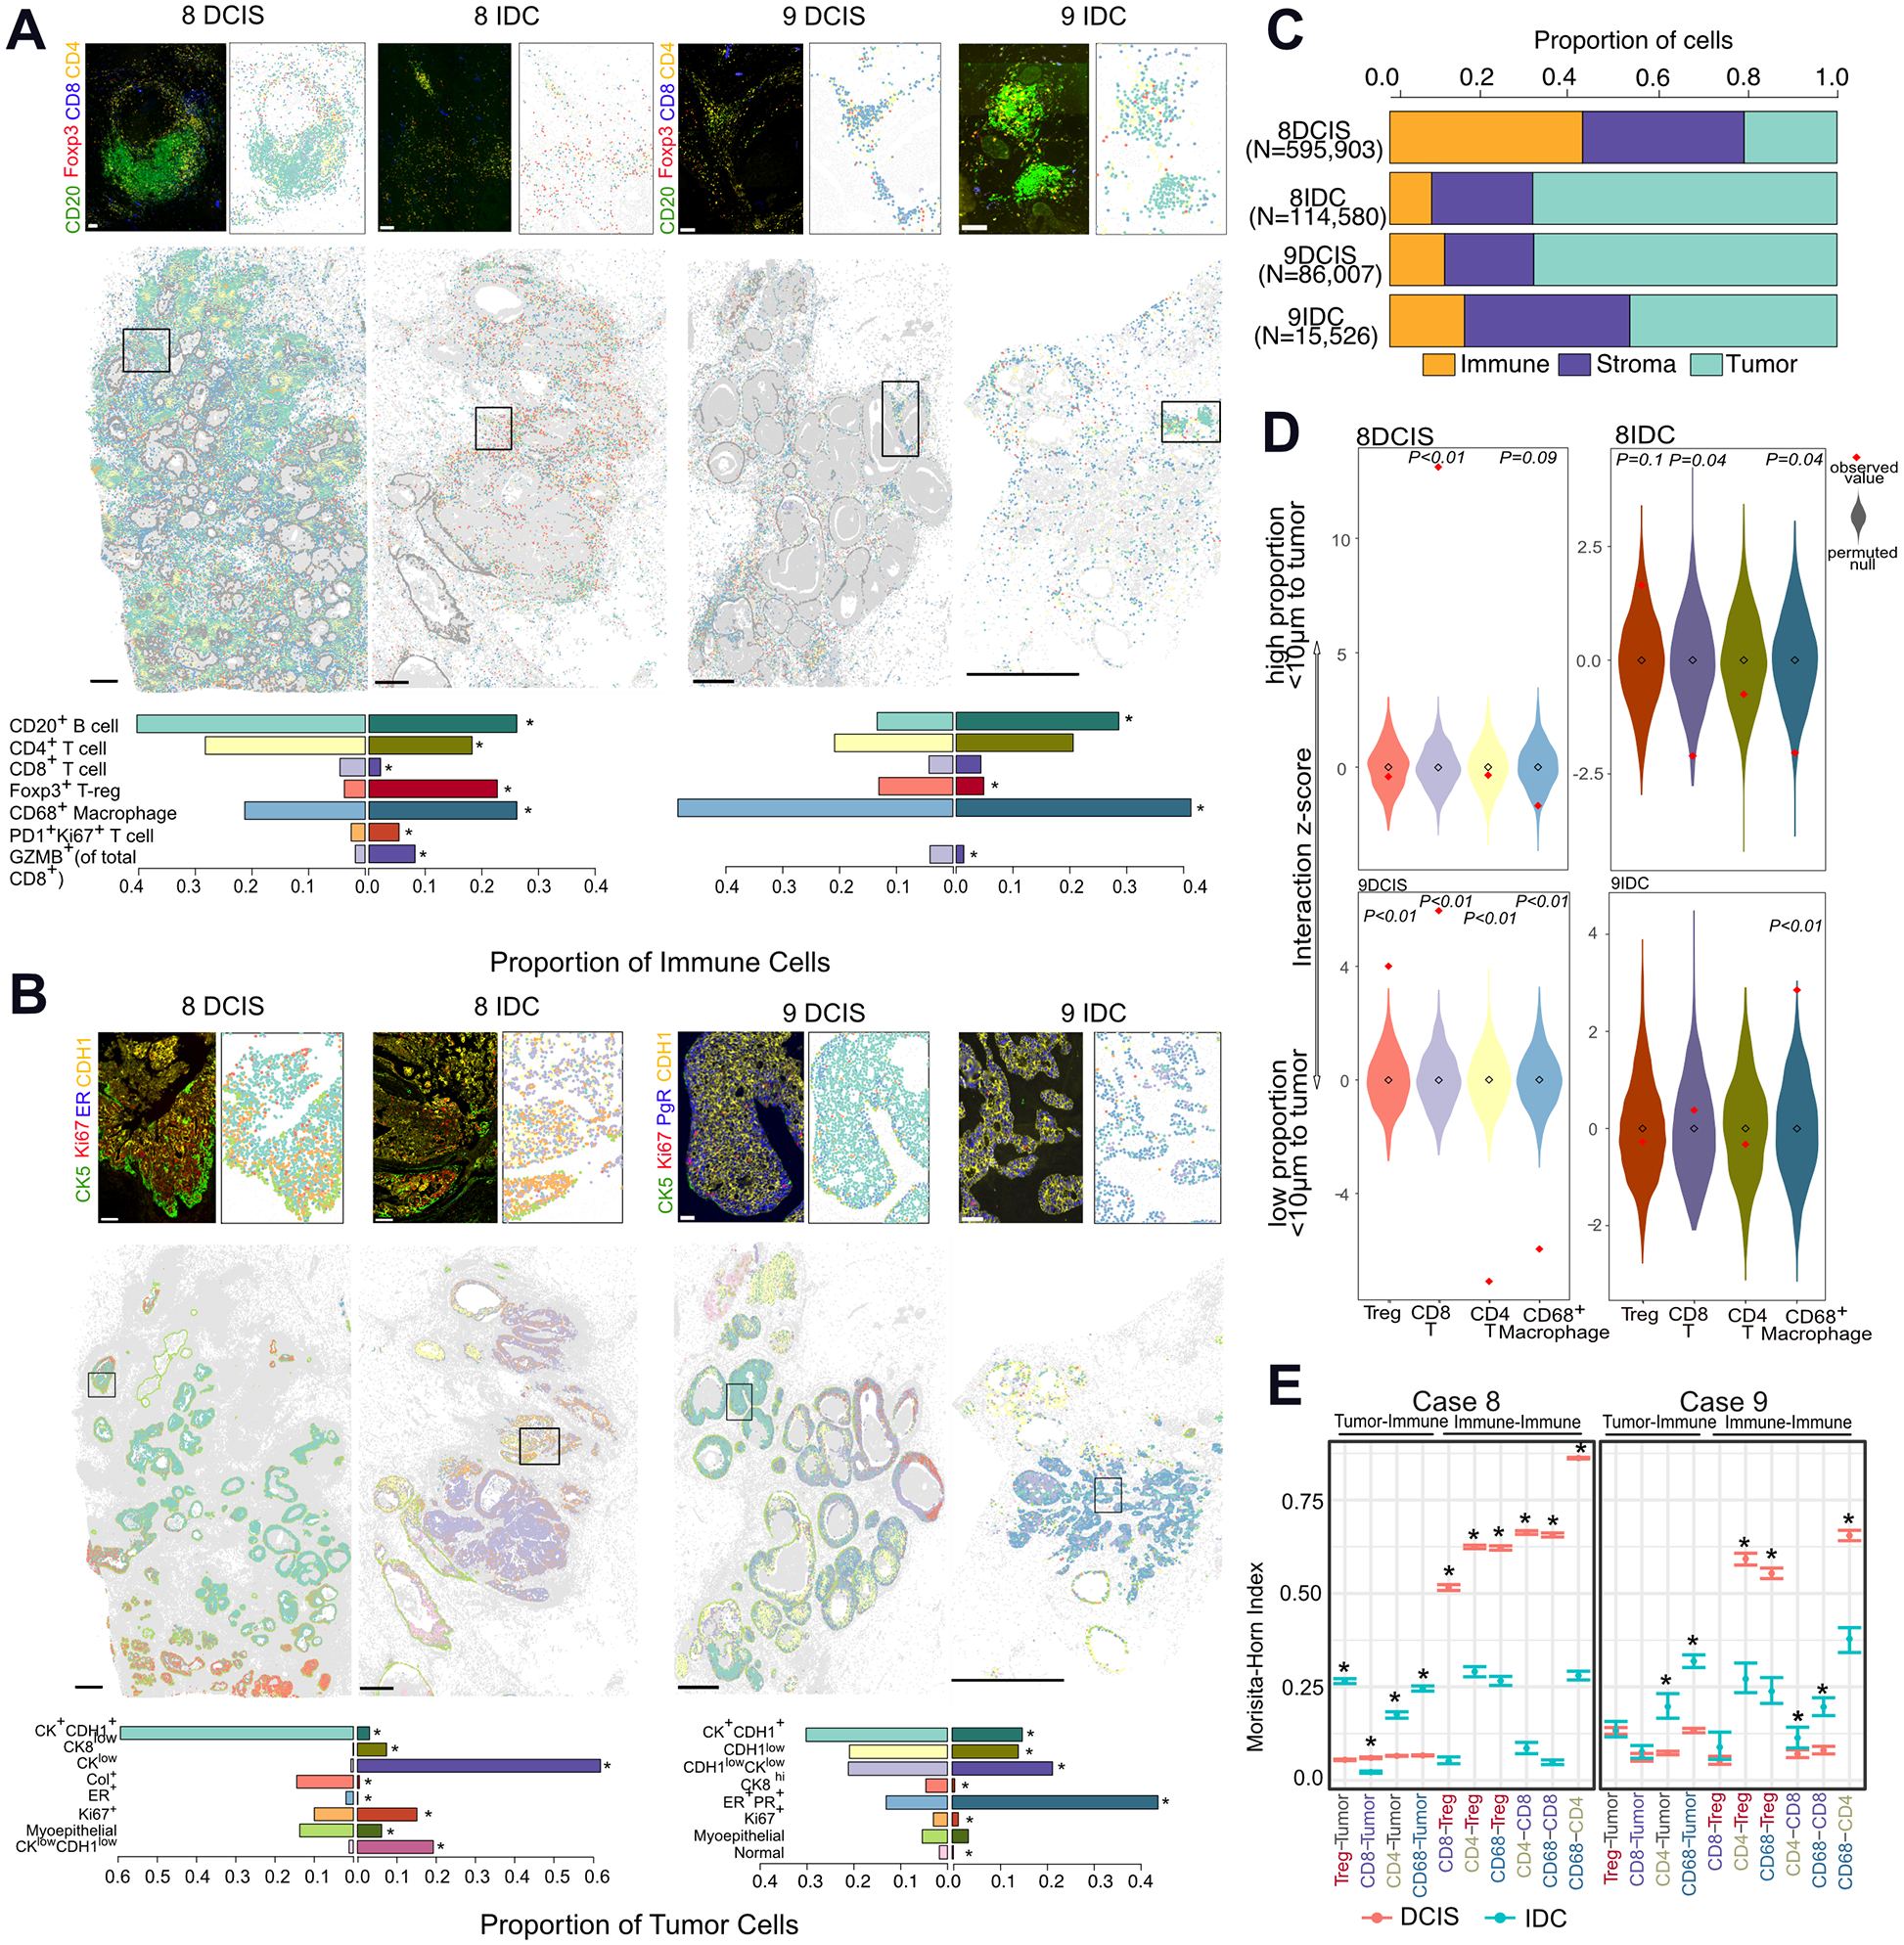
Fig. 4. Cyclic immunofluorescence in DCIS-to-IDC.

A, Whole slide image of classified immune cells in cases 8 and 9, representative image, and relative proportions of immune cells in each sample. Scale bar whole slide image: 1mm, insert: 100μm. Differences were computed using proportionality test, *P <0.05. B, Whole slide image of classified tumor cells in cases 8 and 9, representative image, and relative proportions of tumor cells in each sample. Scale bar whole slide image: 1mm, insert: 100μm. C, Cellular composition in each sample. D, Z-score of the interacting fraction of immune cells to tumor cells. Null distribution was calculated from 1000 permutations of immune cell labels E, Morisita-Horn index of spatial correlation of two interacting-cell populations, *P <0.05.
