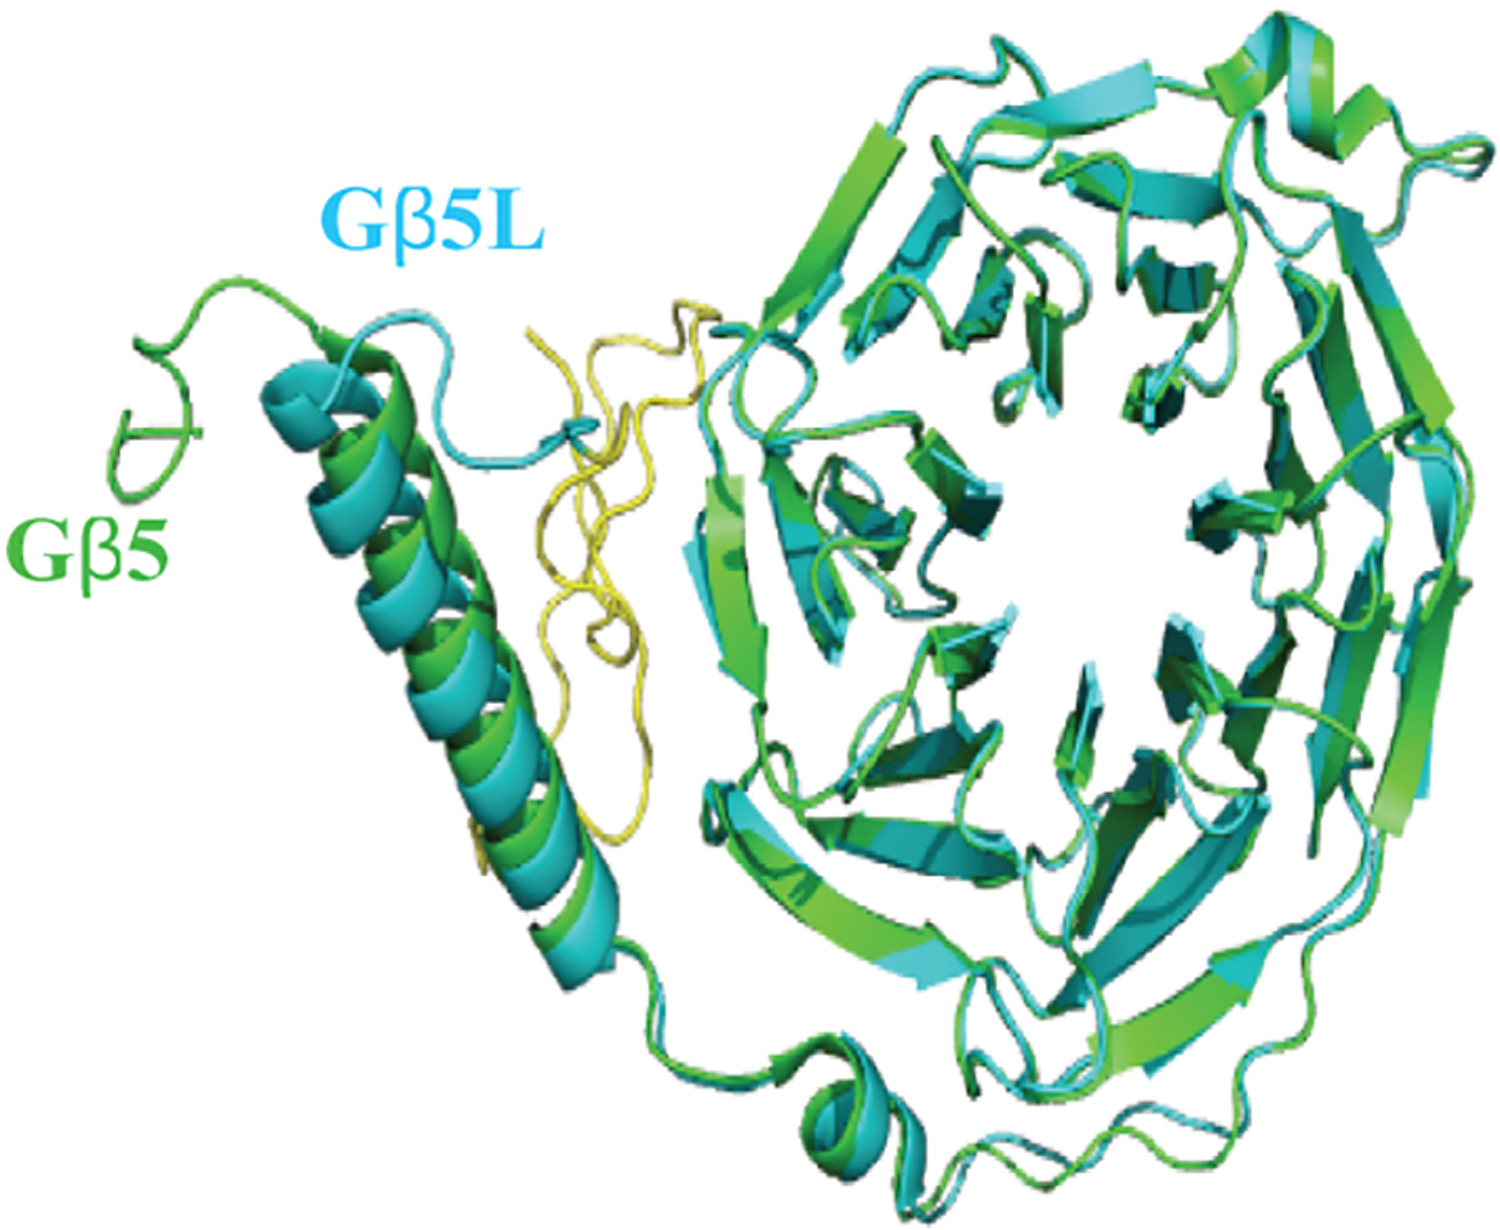
Figure 4. The molecular structure of Gβ5.

Gβ5 (Green) was modelled using coordinates obtained from PDB file 6N9G is superimposed with Gβ5L (Blue), homology model generated from Phyre web portal (http://www.sbg.bio.ic.ac.uk) using Gβ5 as template. The yellow colored region was encoded by the additional codon at the 5′ end.
