
Figure 7. Tissue specific distribution of all 5 Gβ subtypes.
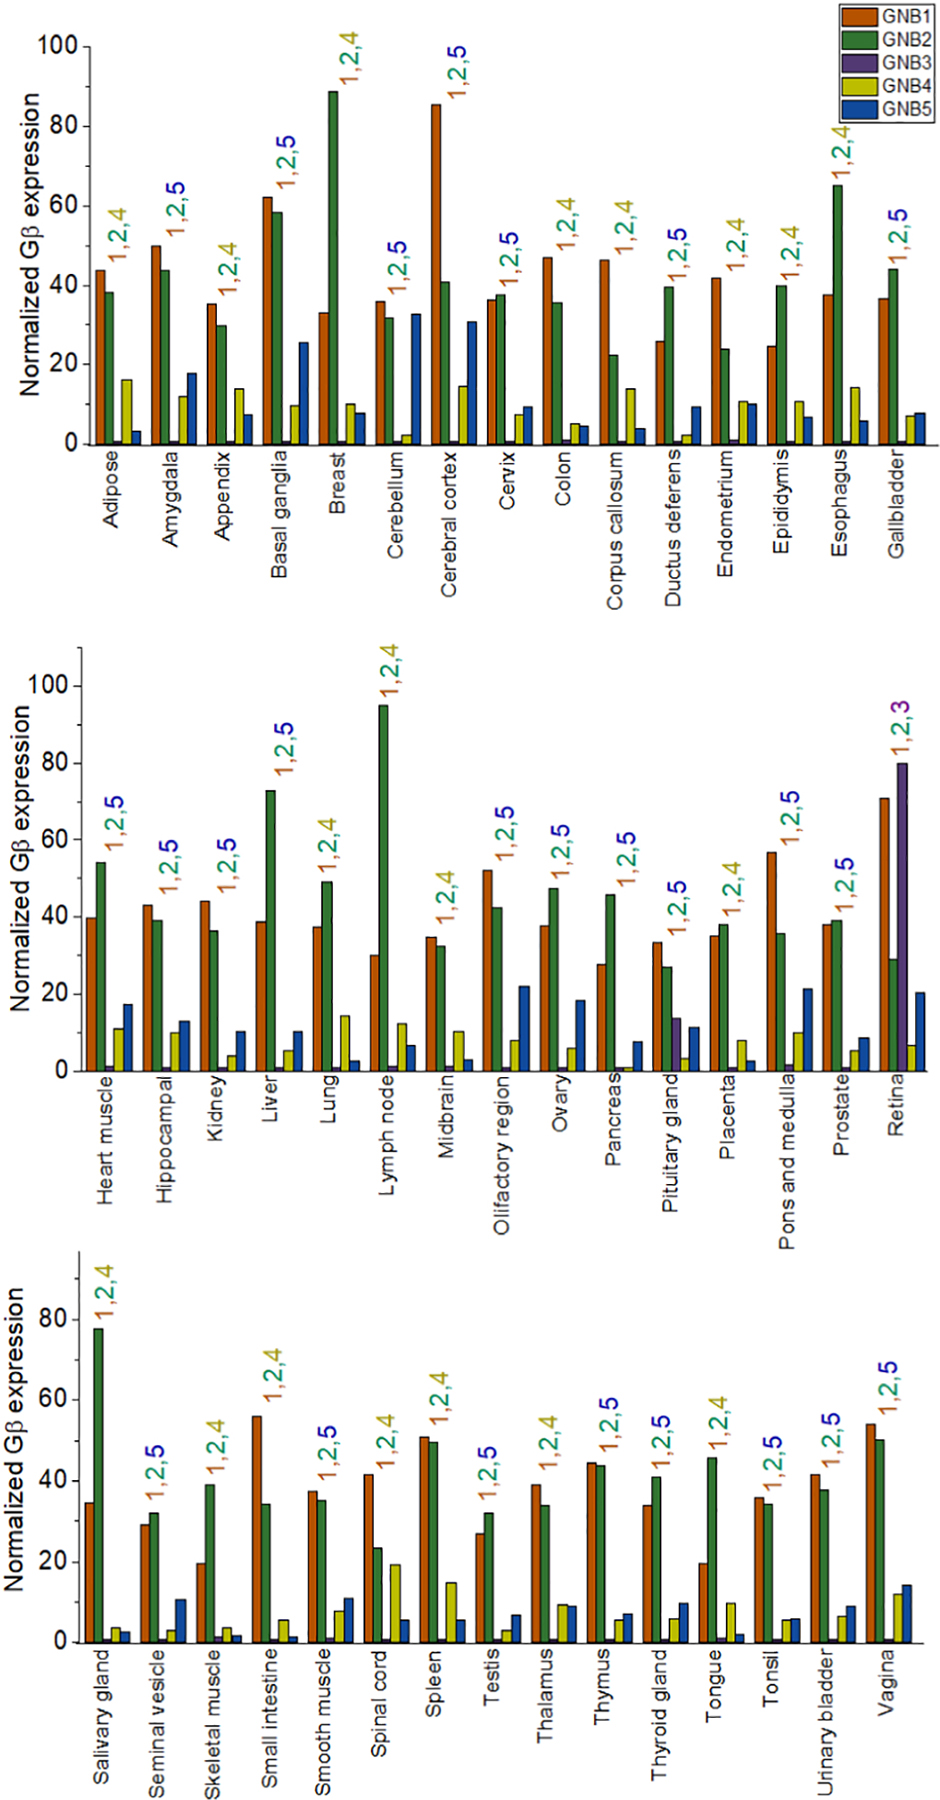
Consensus normalized RNA expression of Gβ subtypes in human tissues. RNA expression data for the distribution of Gβ subtypes in human tissues was obtained from the FANTOM5 repository in the human protein atlas database. Though Gβ subtypes exhibited higher sequence homology, they also show tissue type-specific distributions. The coloured-numbers above each tissue type represent the three most abundant Gβ types.