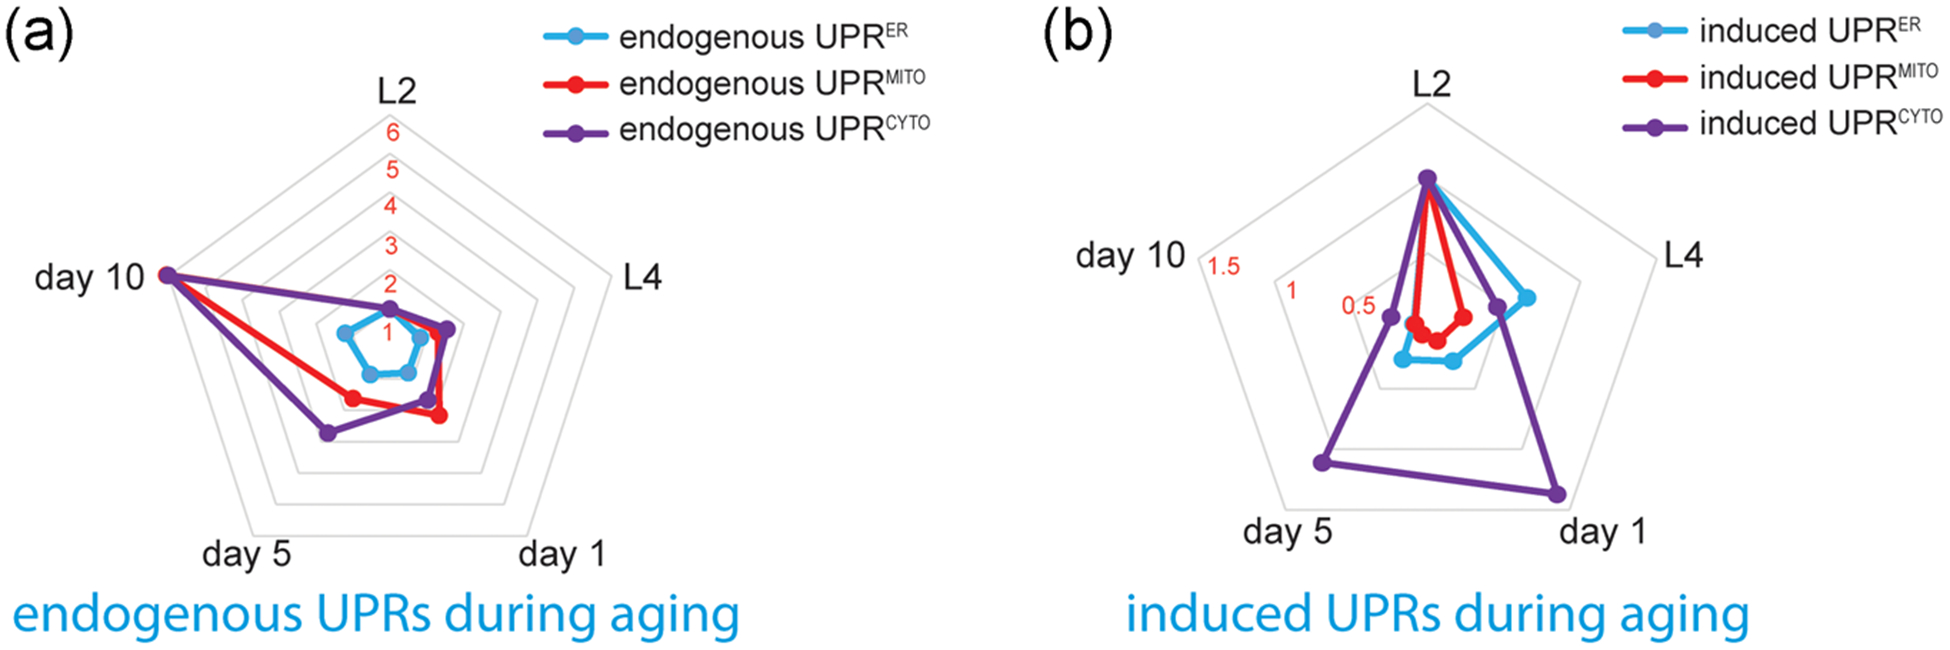
FIGURE 7.

Radar charts of the age-related changes in endogenous UPRs and induced UPRs. A normalized, permutated radar chart is used to compare the endogenous UPRs (a) and induced UPRs (b) at different ages. Based on our fluorescent reporter assays, the mean fluorescence intensities of distinct UPR reporters at different ages are normalized to that of L2 worms. Overall, the endogenous UPRs elevate during aging, while different types of induced UPRs exhibit distinct age-related decline rates. UPR, unfolded protein response
