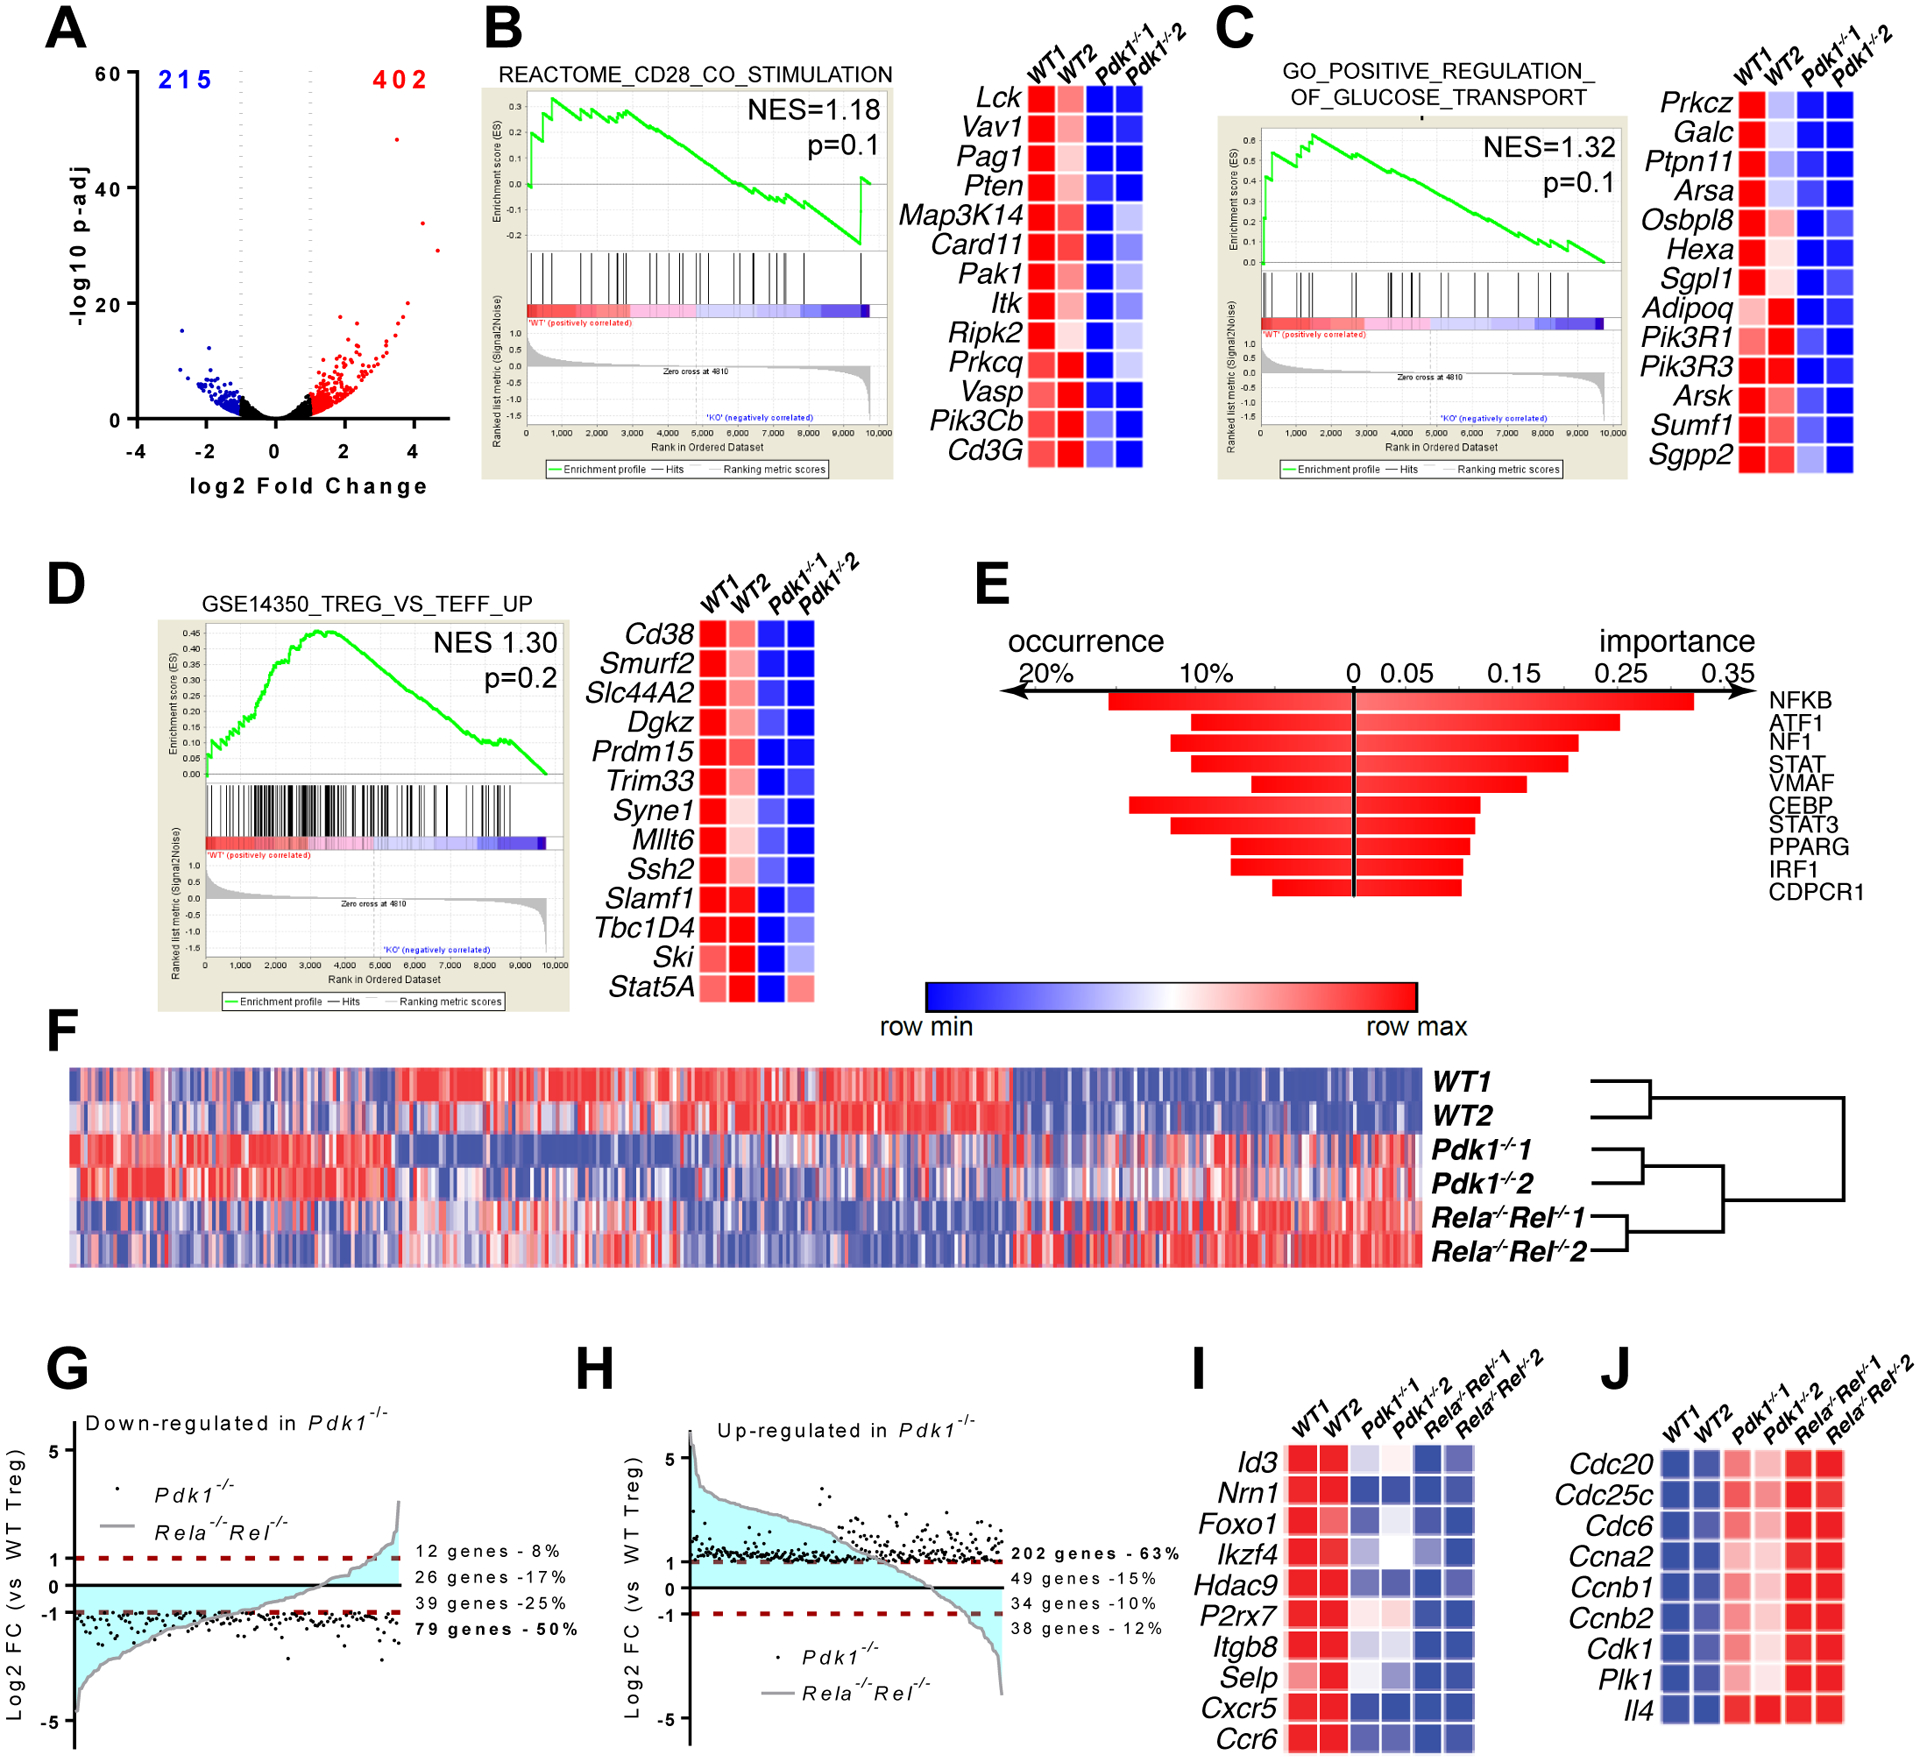
Figure 3. Dysregulation of the Treg transcriptome in the absence of PDK1.

CD4+YFP+ Treg cells from spleen and PLN of (FoxP3YFP-cre and FoxP3YFP-crePdk1f/f were FACS-sorted and submitted to deep RNA-sequencing analysis. (A) Volcano plot showing differentially expressed genes (DEGs) (down-regulated log2 FC<−1 in blue, up-regulated log2 FC>1 in red). (B-D) Datasets were analyzed for signature enrichment using GSEA packages C2, C5 and C7. Representative Enplot graphs and expression heatmaps with selected genes are shown. (E) Transcription factor binding motif enrichment analysis using DiRE, in differentially expressed genes in Pdk1-deficient versus WT Treg cells. (F) Heatmap showing the expression of DEGs from (A), in WT, Pdk1−/− and Rela−/−Rel−/− Treg cells (data from Oh et al., 2017) upon batch correction and hierarchical clustering. (G, H) Plots showing the correlation of changes in gene expression between Pdk1−/− and Rela−/−Rel−/− Treg cells. (G) Genes significantly downregulated in Pdk1−/− cells. (H) Genes significantly upregulated in Pdk1−/− cells. (I, J). Expression heatmaps with selected Treg signature genes (I) and genes involved in cell cycle (J) are shown.
