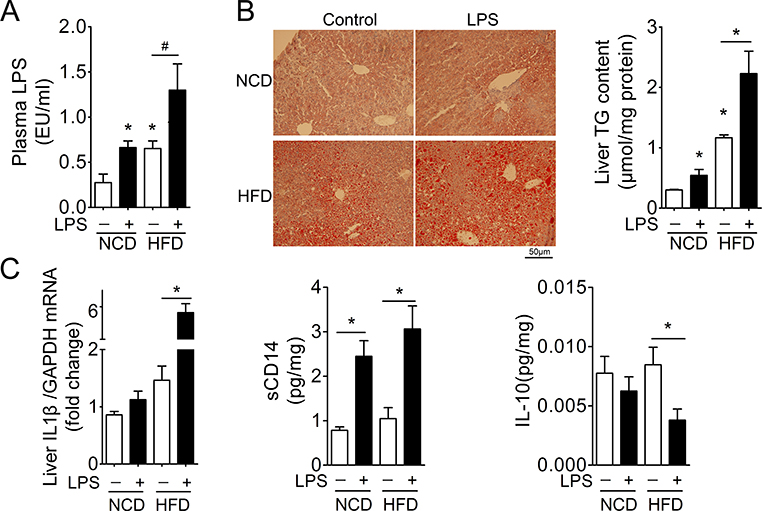
Figure 1. Induction of NASH by continuous infusion of low dose of LPS.
Mice fed NCD or HFD for 12 weeks were continuously infused with LPS at a dose of 240μg/kg/day for 14 days via the implanted micro-osmotic pump. Plasma and liver tissues were then harvested for analysis of NASH. n=6, * denotes P<0.05 vs control.
A. Levels of plasma LPS.
B. H&E staining and hepatic triglyceride (TG) levels.
C. Levels of hepatic cytokines.

