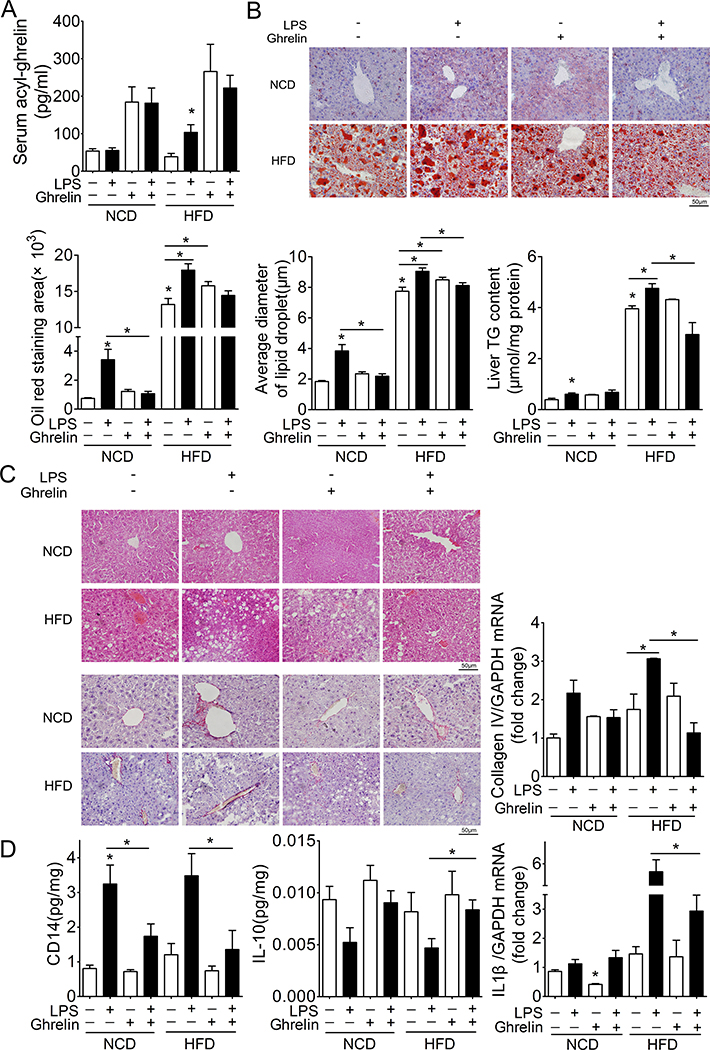
Figure 2. Ghrelin ameliorates NASH induced by low dose LPS.
Ghrelin (11nmol/kg/day) was administrated by subcutaneous micro-osmotic pump implantation into NCD or HFD mice receiving continuous infusion of LPS. Plasma and liver tissues were then harvested for analysis of NASH. n=12, * denotes P<0.05 vs control.
A. Levels of plasma ghrelin.
B. Oil-red staining and hepatic triglyceride (TG) levels.
C. H&E staining and sirius red staining and mRNA levels of collagen IV.
D. Levels of hepatic cytokines.

