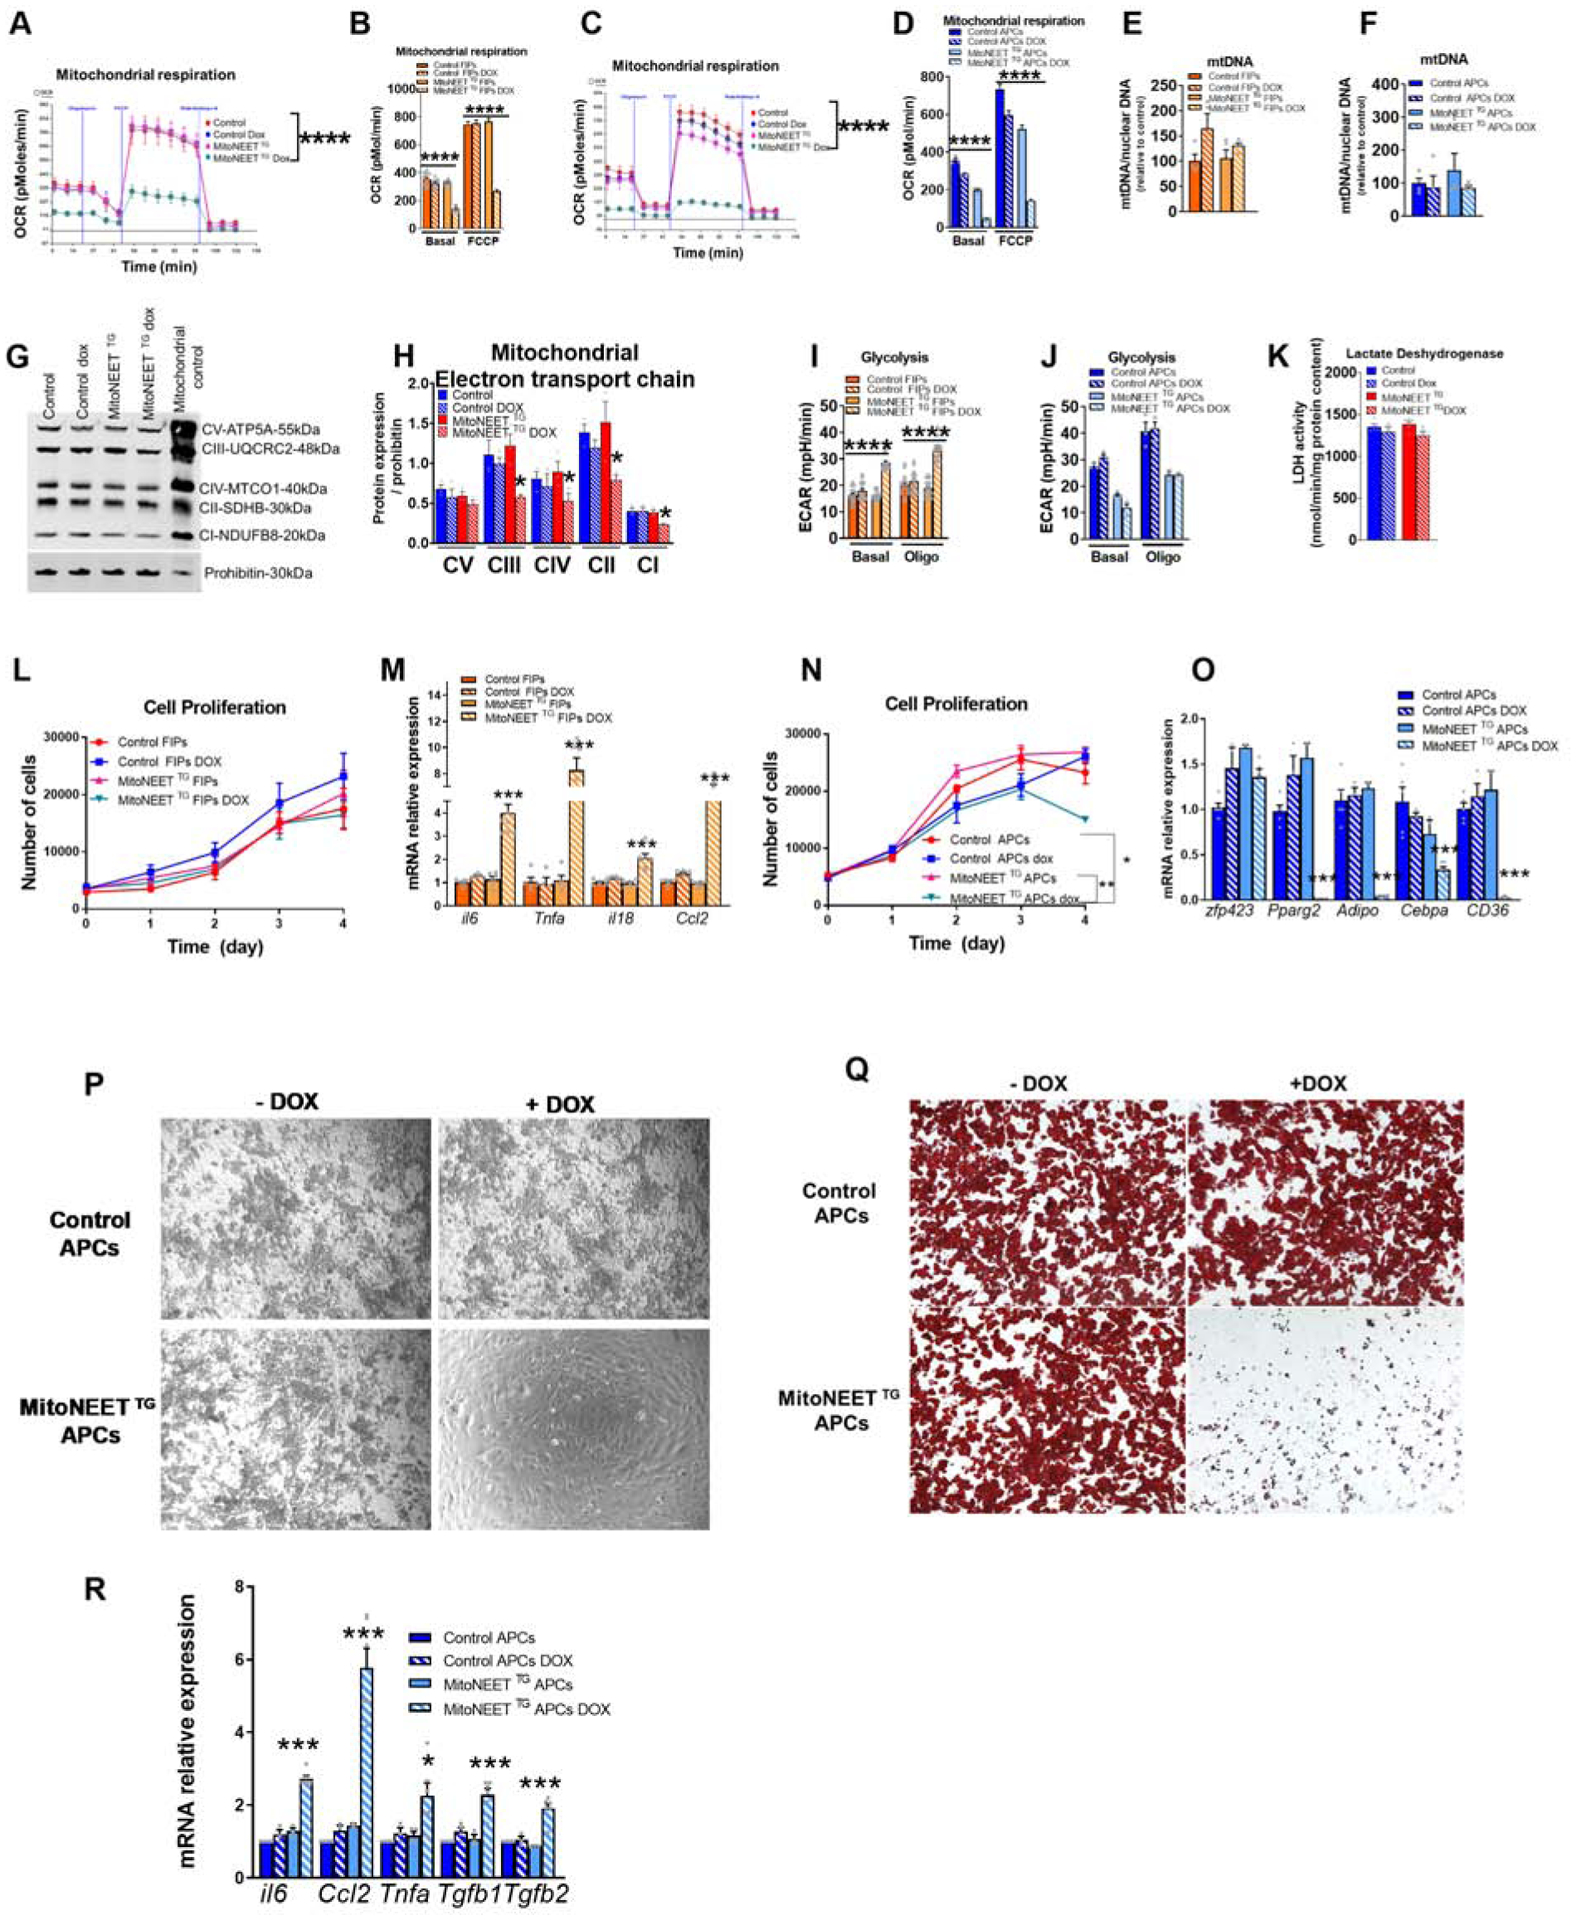
Figure 1. Inducible mitochondrial dysfunction in visceral adipose tissue progenitors (FIPs and APCs) promotes inflammation while decreasing adipogenic capacity in vitro.

Determination of mitochondrial function in FIPs and APCs using PdgfRβ-rtTA mice (controls) and PdgfRβ-rtTA × TRE-MitoNEET mice (MitoNEET TG). FIPs and APCs were sorted from control or MitoNEET TG (eWAT) (A-K,M,O,P,Q,R) FIPs and APCs were wuth 4.4 μM doxycycline for 24h. (A-B) Oxygen consumption rate of FIPs (n=5–15) or APCs cells (n=3) in pmol/min. (C,D). (E,F) mtDNA content of FIPs (n=4–5) (E) and APCs (F) (n=4–5) ratio between mtDNA and nuclear DNA relative to control. (G-H) Western blot representation and quantification of mitochondrial electron transport chain complexes of PDGFRβ+ cells (n=3). (I) Glycolysis rate of FIPs (n=18) (J) and APCs cells (n=3) (K) Lactate dehydrogenase activity of PDGFRβ + cells (n=9) in nmol/min/mg protein content. (L) Cell proliferation of FIPs treated with or without 4.4 uM doxycycline (n=4). (M) Gene expression profile of control or MitoNEET TG FIPs (n=6). (N) Cell proliferation of APCs treated with or without 4.4 uM doxycycline (n=3) (O) Gene expression profiles of adipocyte markers after 6 days of differentiation of APCs (n=3–6). (P) Microscopic images of APCs from control or MitoNEET TG fat pads differentiated for 6 days doxycycline pretreatment (Q) Oil Red O staining of APCs differentiated for 6 days. (R) Gene expression of inflammatory markers of APCs differentiated into adipocyte for 6 days (n=3–6).Significance in (A,C,L,N) was calcultated using a 2-way Anova with Tukey’s post-test for multiple comparisons. Significance in (B,D,E,F,H,I,J,K,M,O,R) was calculated using a Kruskal-Wallis (One-Way Anova) test with Dunn’s post-test for multiple comparisons. Error bars represent mean ± S.E.M. * (P<0.05), ** (p<0.01), *** (p<0.0001), **** (p<0.00001).
