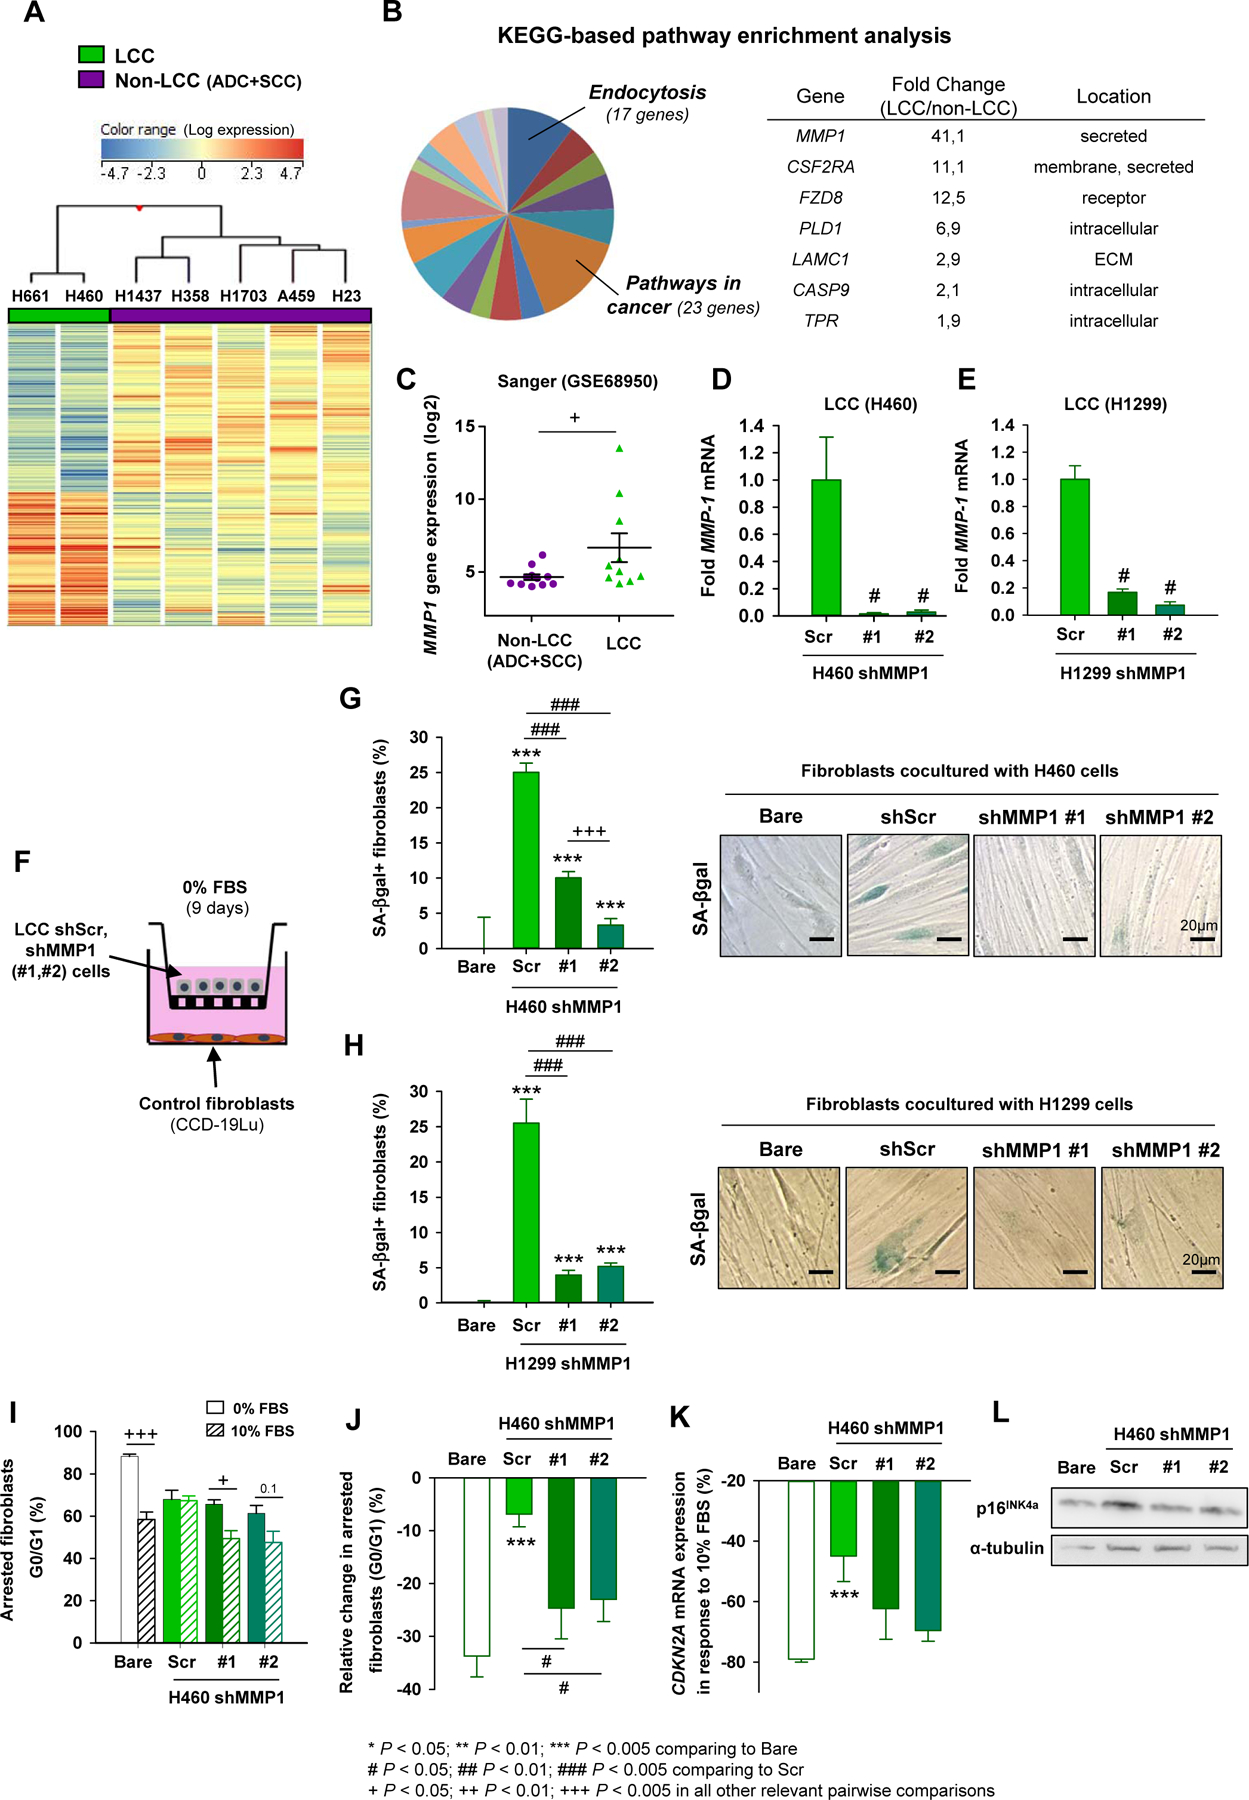
Fig. 1. MMP1 overexpression in LCC cells and its role in the paracrine induction of fibroblast senescence.

A, Hierarchical clustering of 1052 differentially expressed probesets between a subset of LCC and non-LCC cell lines. B, KEGG-based pathway enrichment analysis identified Pathways in Cancer as the largest over-represented pathway (Supplementary Table 3), in which MMP1 was the single gene coding for a secreted factor within the top 5 LCC-upregulated genes. C, MMP1 mRNA expression from the Sanger dataset in an extended panel of cancer cell lines. D and E, MMP1 expression in H460 (D) and H1299 (E) LCC cell lines after MMP1 knock-down by shRNA using two plasmids (#1, #2) and shScramble (Scr) as a control. F, Outline of the LCC cell-fibroblast cocultures with transwells. G and H, Percentage of SA-βgal+ fibroblasts upon coculture with shMMP1 H460 (G) or H1299 (H) LCC cells as in (F). Representative SA-βgal images shown to the right. I and J, Percentage of growth arrested fibroblasts (I) cocultured with H460 cells as in (F), and corresponding relative change (J). K and L, Relative change in the CDKN2A (p16INK4a) mRNA (K) or protein (L) expression of fibroblasts cocultured as in (J). Similar results were obtained with H1299 (Supplementary Fig. S1E) and H661 (Supplementary Fig. S1F) cells. Error bars indicate mean ± s.e.m. *, P < 0.05; **, P < 0.01; ***, P < 0.005 comparing to Bare conditions. #, P < 0.05; ##, P < 0.01; ###, P < 0.005 comparing to Scr. + P < 0.05; ++ P < 0.01; +++ P < 0.005 in all other relevant pairwise comparisons. All comparisons were done using Student t test. Mean values correspond to n = 4 experiments (D-K).
