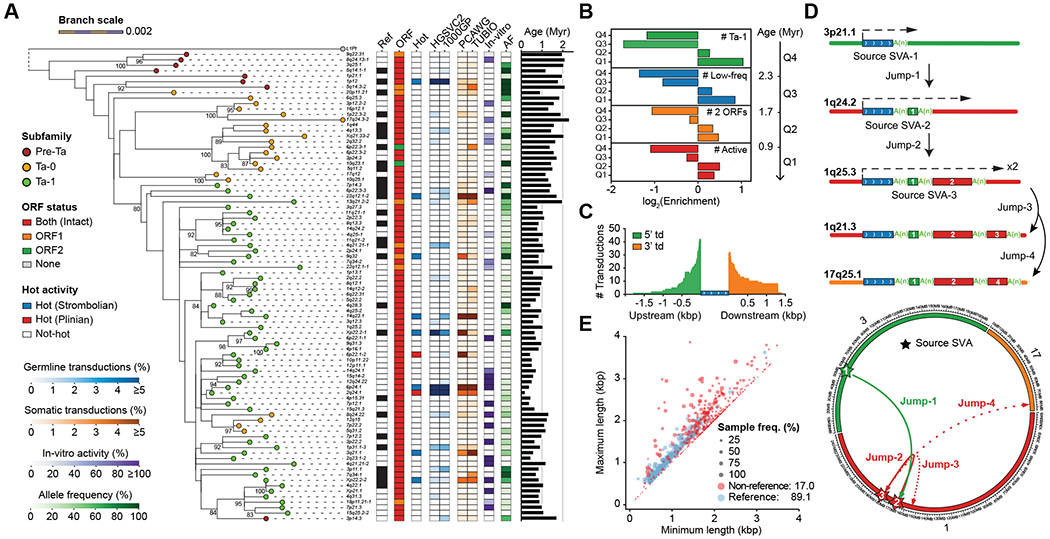
Fig. 3. Mobile element insertions.

(A) Maximum-likelihood phylogenetic tree (85) for highly active sequence-resolved FL-L1s annotated by subfamily designation, presence/absence on the reference, ORF content, and hot activity profile (34–36) (bootstrap values ≥80% shown). Tree branch lengths are scaled according to the average number of substitutions per base position. Dashed lines map each L1 cytoband identifier to its corresponding branch on the tree. Pan troglodytes (L1Pt) is included as an outgroup. Heatmaps represent allele frequency (AF) based on the assembly discovery set, activity estimates based on in vitro assays (31, 32) and the number of transduction events detected in human populations (33) or cancer studies (34–36). (B) Enrichment and depletion in the number of FL-L1s belonging to the Ta-1 subfamily at age quartiles (Q1-Q4) compared with a random distribution. Same applies for the other features, including the number of FL-L1s with low allele frequency (MAF<5%), with two intact ORFs, or with evidence of activity. (C) Size distribution and number of 5′ and 3′ SVA-mediated transductions (td) based on the analysis of flanking sequences. (D) Schematic and circos representation for serial SVA-mediated transduction events. Dashed arrows indicate SVA transcription initiation and end. Transduced sequences are shown as colored boxes with their length proportional to transduction size. (E) Distributions of VNTR length (x-axis: the minimum, y-axis: the maximum) of reference and non-reference SVA elements. Reference SVAs are shown as blue dots and non-reference SVAs as red dots. The dot size represents the sample frequency of SVAs among discovery samples in the HGSVC.
