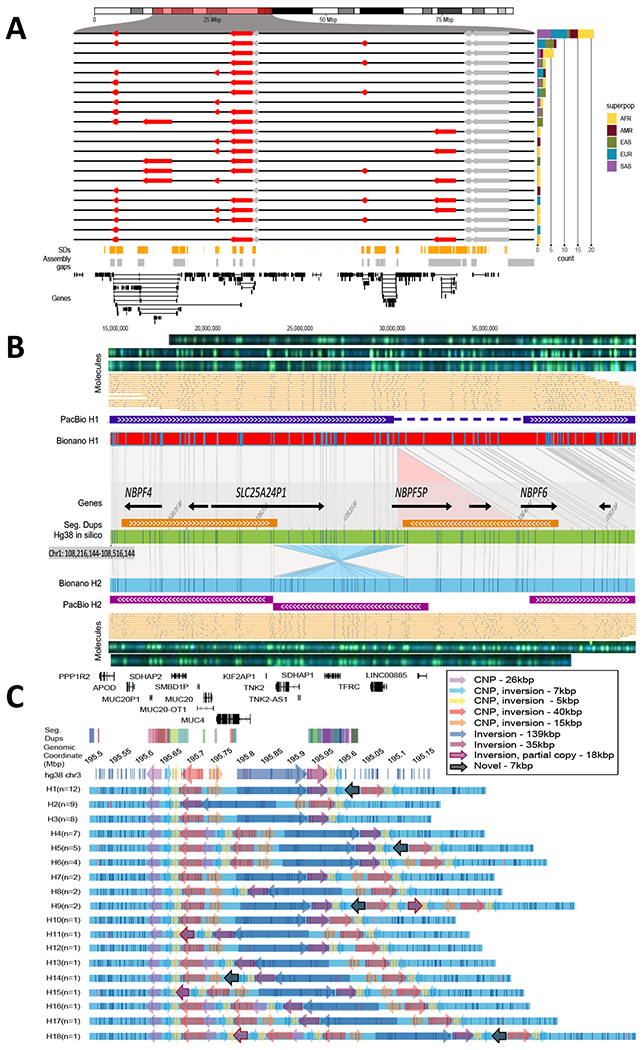
Fig. 4. Complex patterns of structural variation.

(A) An inversion hotspot mapping to a 2.5 Mbp gene-rich region of chromosome 16p12 (highlighted portion of ideogram). Haplotype structure of inversions (red arrows) are compared to the GRCh38 reference orientation (black lines) as well as additional inversions (gray), which could not be haplotype integrated because of uninformative markers. A barplot (right panel) enumerates the frequency of each distinct inversion configuration (n=22) by superpopulation for the 64 phased genomes. Bottom panels: Shows distribution of SDs (orange), assembly gaps (gray), and genes (black) in a given region. (B) A partially resolved complex SV locus (HG00733 at chr1:108,216,144-108,516,144). Optical maps generated by DLE1 digestion predict a deletion (red bar, Bionano H1) and an inversion (blue bar, Bionano H2) when compared to GRCh38 (green bar). Haplotype structures are strongly supported by extracted single molecules (beige) and raw images (green dots). Phased assembly correctly resolves the hap1 deletion (purple top) and Strand-seq detects the inversion (blue) but misses the flanking SD, which is a gap in the H2 assembly (gap). (C) Haplotype structural complexity at chromosome 3q29. Optical mapping of a 410 kbp gene-rich region (chr3:195,607,154-196,027,006) predicts 18 distinct structural haplotypes (H1-H8) that vary in abundance (n=1 to 12) and differ by at least nine copy number SDs and associated inversion polymorphisms (see colored arrows). This hotspot leads to changes in gene copy and order (GENCODE v34 top panel): 26 haplotypes are fully resolved by phased assembly (21 CLR, 5 HiFi) and the median MAP60 contig coverage of the region is 96.1%.
