
Fig. 2.
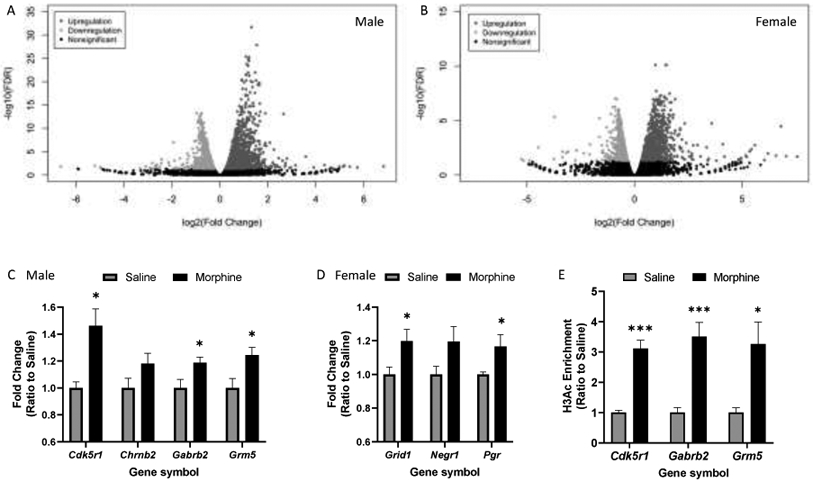
Transcriptional and epigenetic changes in the rat dmPFC following the 10-day morphine/saline injection regimen. (A, B) Volcano plots generated from unfiltered RNA-seq data from males and females, respectively [FDR, False Discovery Rate corrected p-value (q-value)]. (C, D) RT-qPCR validation of male and female RNA-seq datasets (n = 5-6/group; * p < 0.05 compared with the respective saline control group). (E) ChIP-qPCR revealed H3Ac enrichment at upregulated gene promoter regions (n = 4-5/group; * p < 0.05, *** p < 0.001).