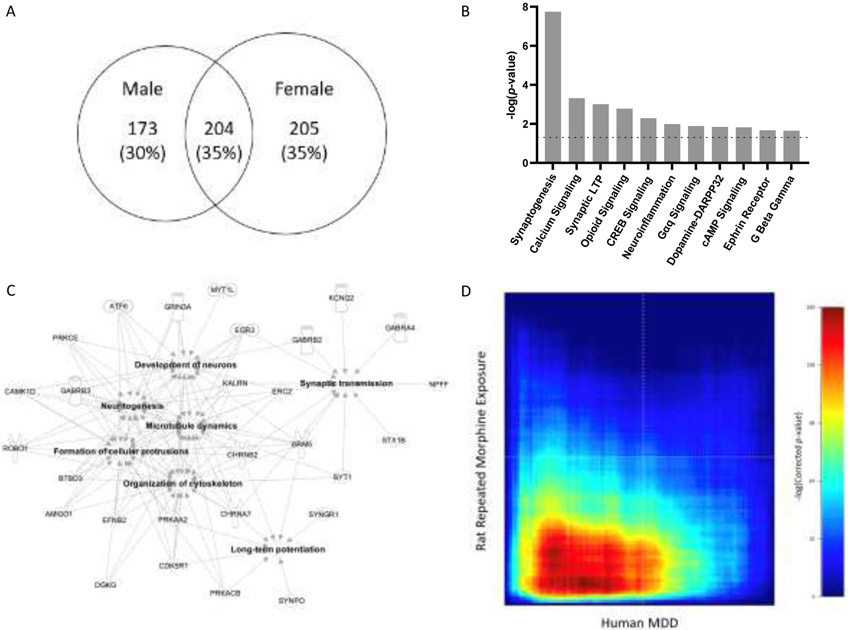
Fig. 3.
Overlapping genes, affected canonical pathways and gene networks analyses. (A) Venn diagram of filtered total number of DEGs in males and females. (B) DEGs in both males and females were enriched in cell signaling-, and synaptic growth- and plasticity-related pathways [absolute z-score ≥ 2; p-value < 0.05, −log(p-value) > 1.3, dotted line]. (C) Annotated functions of gene networks in dmPFC affected in all morphine-treated rats (absolute z-score ≥ 2; p-value < 0.05). (D) RRHO comparing differential gene expression in human MDD patients versus controls and morphine-exposed rats versus control rats. The red signal in the bottom left quadrant represents the presence of significantly co-upregulated genes in experimental groups in the two studies (Maximum hypergeometric p-adj < 1 x 10−160).

