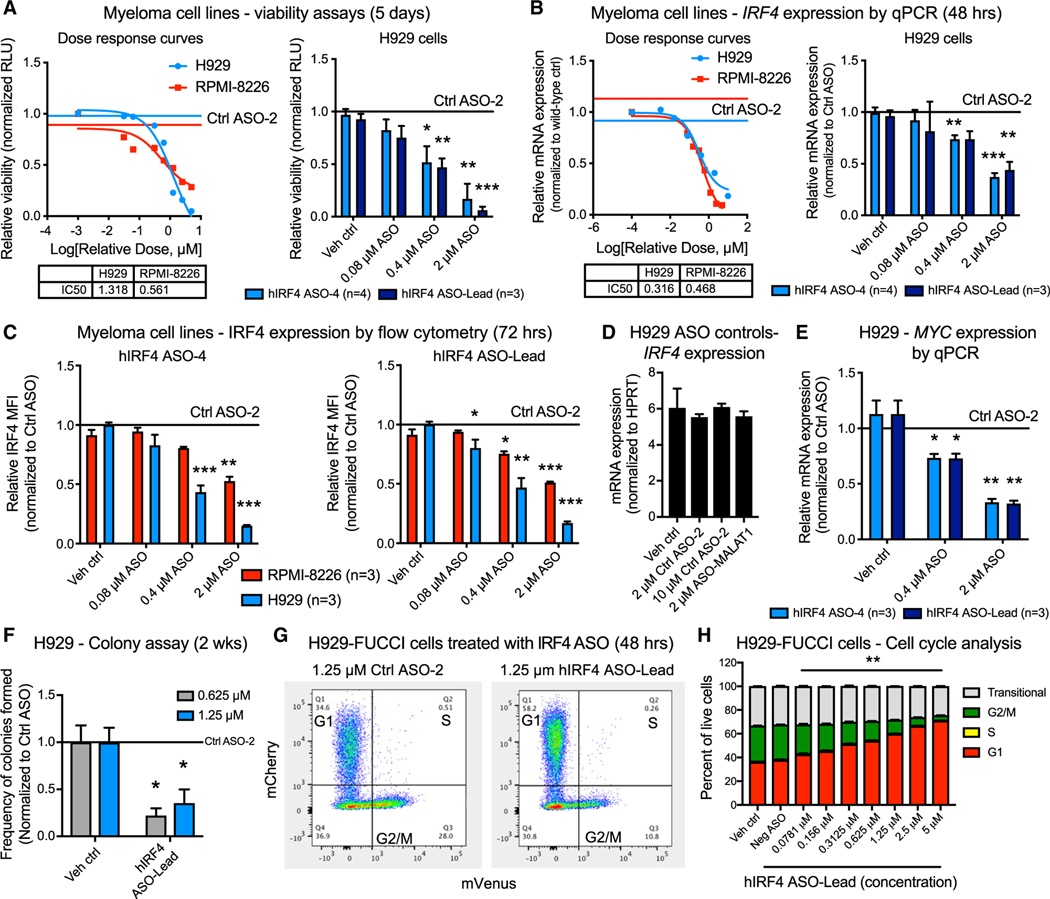
Figure 2. Selective antisense oligonucleotides targeting IRF4 reduce MM cell viability commensurate with reduced IRF4 and c-MYC expression and induction of cell cycle arrest.
(A) Luminescence-based cell viability (CellTiter Glo) assays showing representative dose response curves of H929 and RPMI-8226 myeloma cells (left) and quantification of biological replicate assays performed in H929 cells (right) after treatment with increasing doses of human (h)IRF4-targeted ASOs for 5 days (n = 3 to 4 biological replicates analyzed from separate passages of cells).
(B) Quantitative RT-PCR analyses showing human IRF4 expression in representative dose response curves of H929 and RPMI-8226 myeloma cells (left) and quantification of biological replicate assays performed in H929 cells (right) treated with increasing doses of hIRF4-targeted ASOs for 48 h (n = 3 to 4 biological replicates analyzed in separate passages of cells).
(C) Flow-cytometry-based quantification of intranuclear human IRF4 protein expression in H929 and RPMI-8226 cells treated with hIRF4 ASO-4 (left) and hIRF4 ASO-Lead (right). MFI values quantified within the live, CD38+ population of cells after treatment with ASOs for 72 h (n = 3 biological replicates analyzed from separate passages of cells).
(D) IRF4 mRNA expression in H929 cells treated with control ASO agents, including 2–10 μM Ctrl ASO and ASO specific for a non-IRF4 target (human MALAT1).
(E) Quantitative RT-PCR analysis of MYC expression in hIRF4 ASO-treated H929 cells (n = 3 biological replicates analyzed from separate passages of cells).
(F) Colony formation assay of H929 cells after treatment with hIRF4-targeted ASOs (n = 3 individual wells analyzed per condition).
(G and H) Flow cytometric gating strategy (G) and quantification (H) of cell cycle status in H929-FUCCI cells treated with hIRF4 ASO (n = 3 individual wells analyzed per condition).
Bar graphs show means ± SEM; *p < 0.05, **p < 0.01, and ***p < 0.001 compared to vehicle (PBS)-treated cells by unpaired, two-tailed Student’s t test. See also Figures S2, S3, and S6, Table S2, and Video S1.

