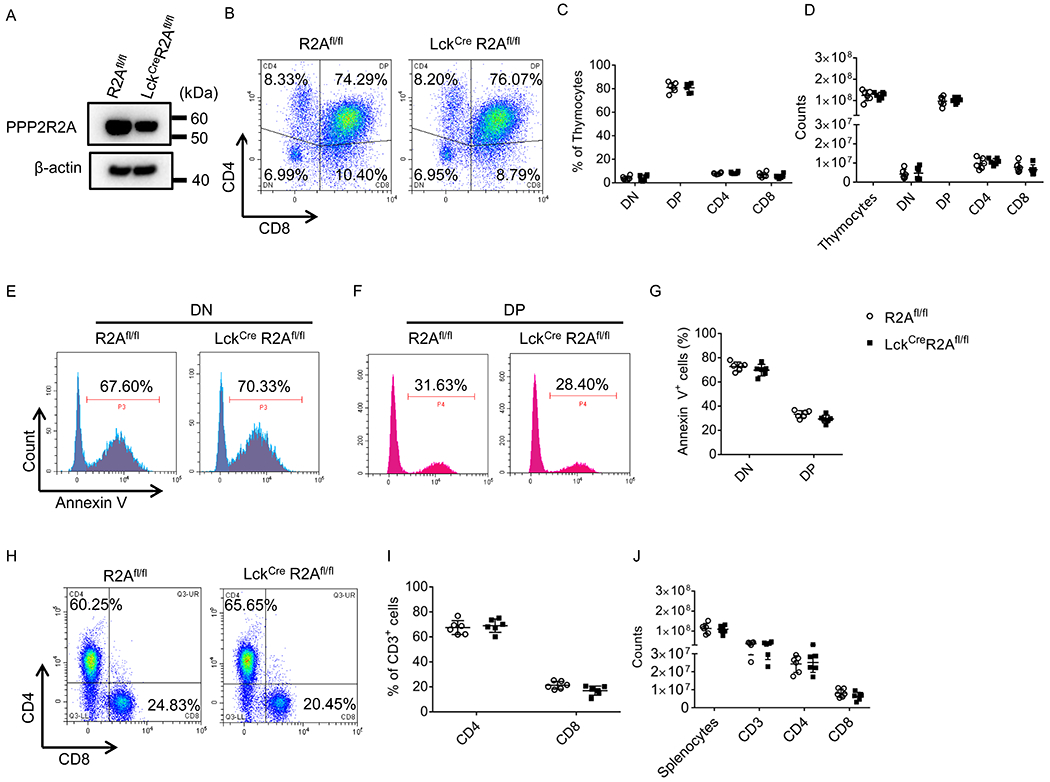
Figure 3. PPP2R2A deficiency in T cells does not impair T cell development in the thymus and the subset distribution in the spleen.

(A) Total protein was extracted from thymocytes isolated from R2Afl/fl or LckcreR2Afl/fl mice and subjected to Western blot analysis. (B-D) Thymocytes isolated from R2Afl/fl or LckcreR2Afl/fl mice were stained with CD4 and CD8 antibodies and analyzed by flow cytometry. (B) Representative flow cytometry plots. Cumulative data (n=6 mice/group) depicting the percentages (C) and absolute numbers (D) of thymocyte cell populations. DN: Double negative; DP: Double positive. (E-G) Thymocytes isolated from R2Afl/fl and LckcreR2Afl/fl mice were stimulated with CD3 antibody (1 μg/ml) overnight, and subsequently stained with Annexin V, CD4 and CD8 antibodies followed by FACS analysis. (E and F) Representative flow cytometry plots. (G) Cumulative data (n=6 mice/group) depicting the percentage of Annexin V-positive DN or DP thymocytes. (H-J) Splenocytes isolated from R2Afl/fl or LckcreR2Afl/fl mice were stained with CD3, CD4 and CD8 antibodies and analyzed by flow cytometry. (H) Representative flow cytometry plots. Cumulative data (n = 6 mice/group) depicting the percentages (I) and absolute numbers (J) of splenic CD3, CD4 or CD8 positive cells. All the data were obtained from two independent experiments.
