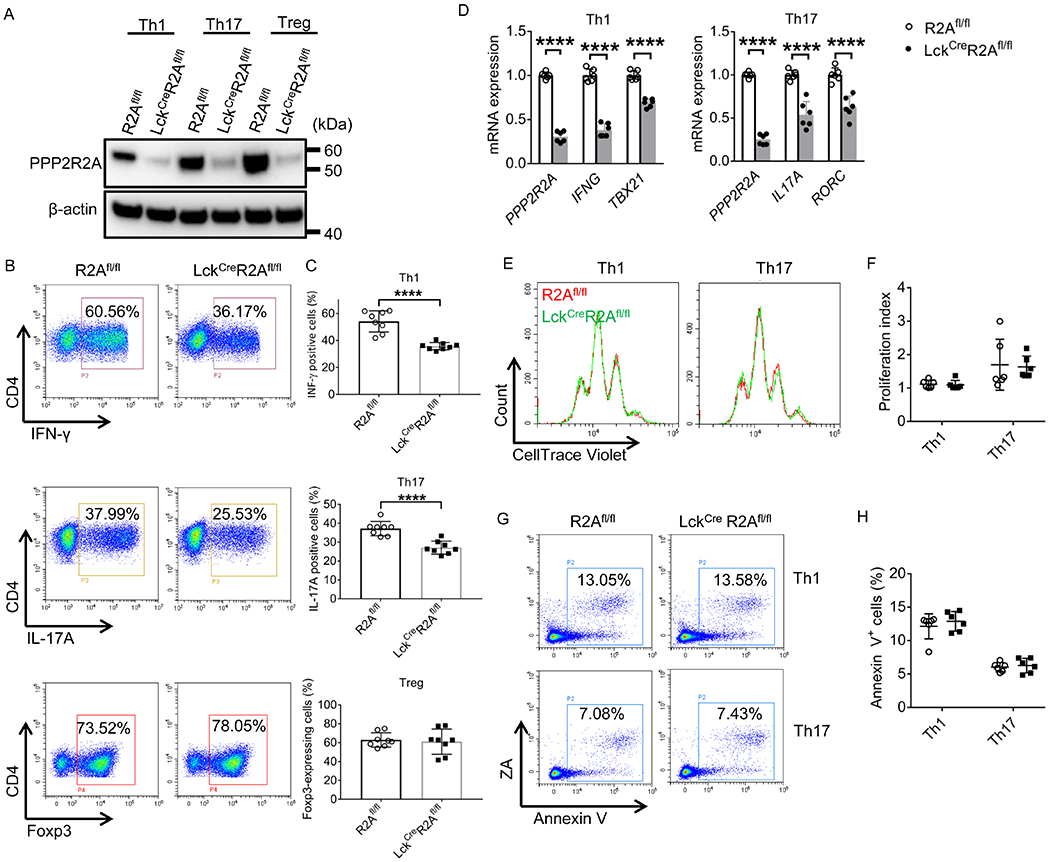
Figure 4. PPP2R2A deficiency in T cells reduces Th1 and Th17 cell differentiation in vitro.

(A-C) After R2Afl/fl and LckCreR2Afl/fl naive CD4+ T cells were cultured under Th1 -, Th17 - or Treg-polarizing conditions for 3 days, total protein was isolated for Western blot analysis (A), or cells were stained with the indicated antibodies before FACS analysis (B-C). Representative flow cytometry plots are shown in (B). Cumulative data (n = 8 mice/group) depicting the percentages of IFN-γ (Th1)- and IL-17A (Th17)-producing cells and Foxp3 (Treg)-expressing cells are shown in (C). (D-H) After R2Afl/fl and LckcreR2Afl/fl naive CD4+ T cells were cultured under Th1-, or Th17- polarizing conditions for 2 days (E and F), or 3 days (D, G and H) in vitro, total RNA (D) was isolated for qPCR analysis (n = 6 mice/group), or cells were collected for cell proliferation (E and F) or apoptosis (G and H) analysis using flow cytometry. Representative flow cytometry plots are shown in (E and G). Cumulative data (n = 6 mice/group) depicting proliferation index (F) or the percentages of apoptotic cells (H). ****P<0.0001 by unpaired T test. The data were obtained from four (A-C) or three (D-H) independent experiments.
