
Figure 1.
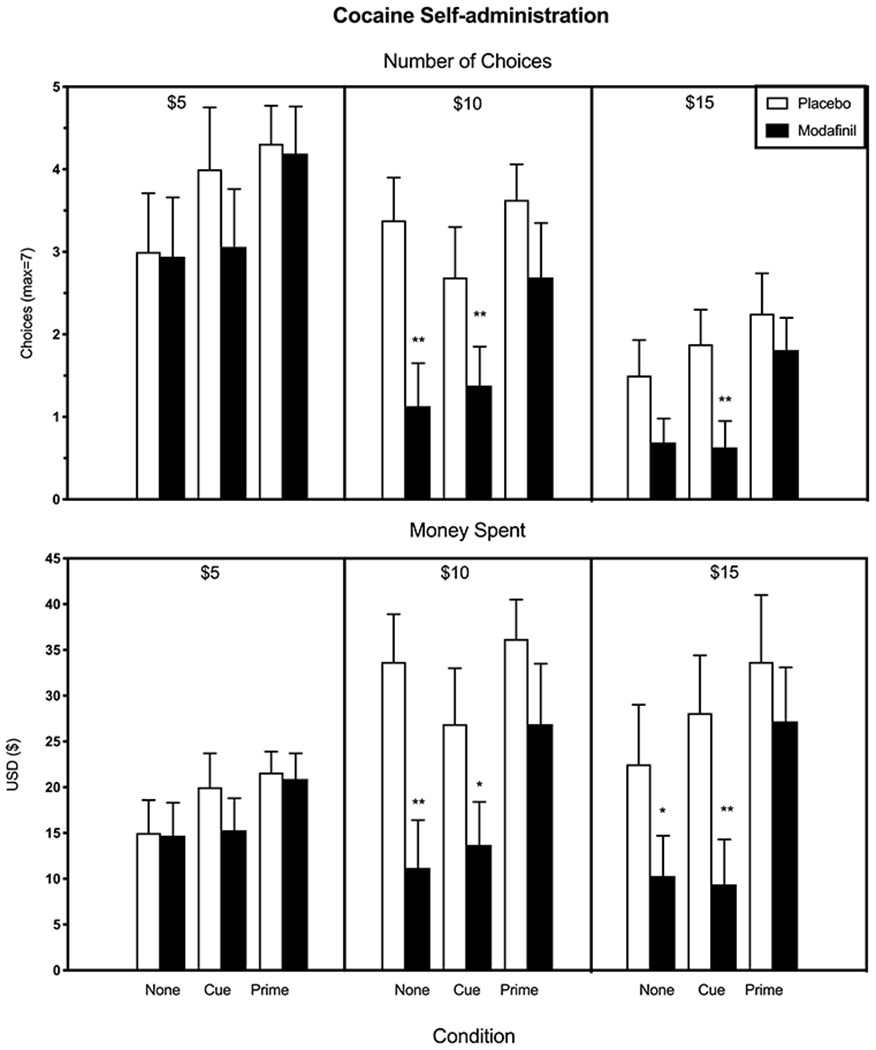
Mean number of cocaine choices (top) and amount of money spent on self-administration (bottom) as a function of modafinil dose, cost per cocaine administration, and cue/prime condition; each bar reflects data from all participants (n=16). Error bars represent + SEM. Asterisks denote a significant difference between active and placebo modafinil for each cue/prime and cost condition (*p < 0.01, ** p < 0.005). Note, chosen doses that were chosen and paid for were administered.