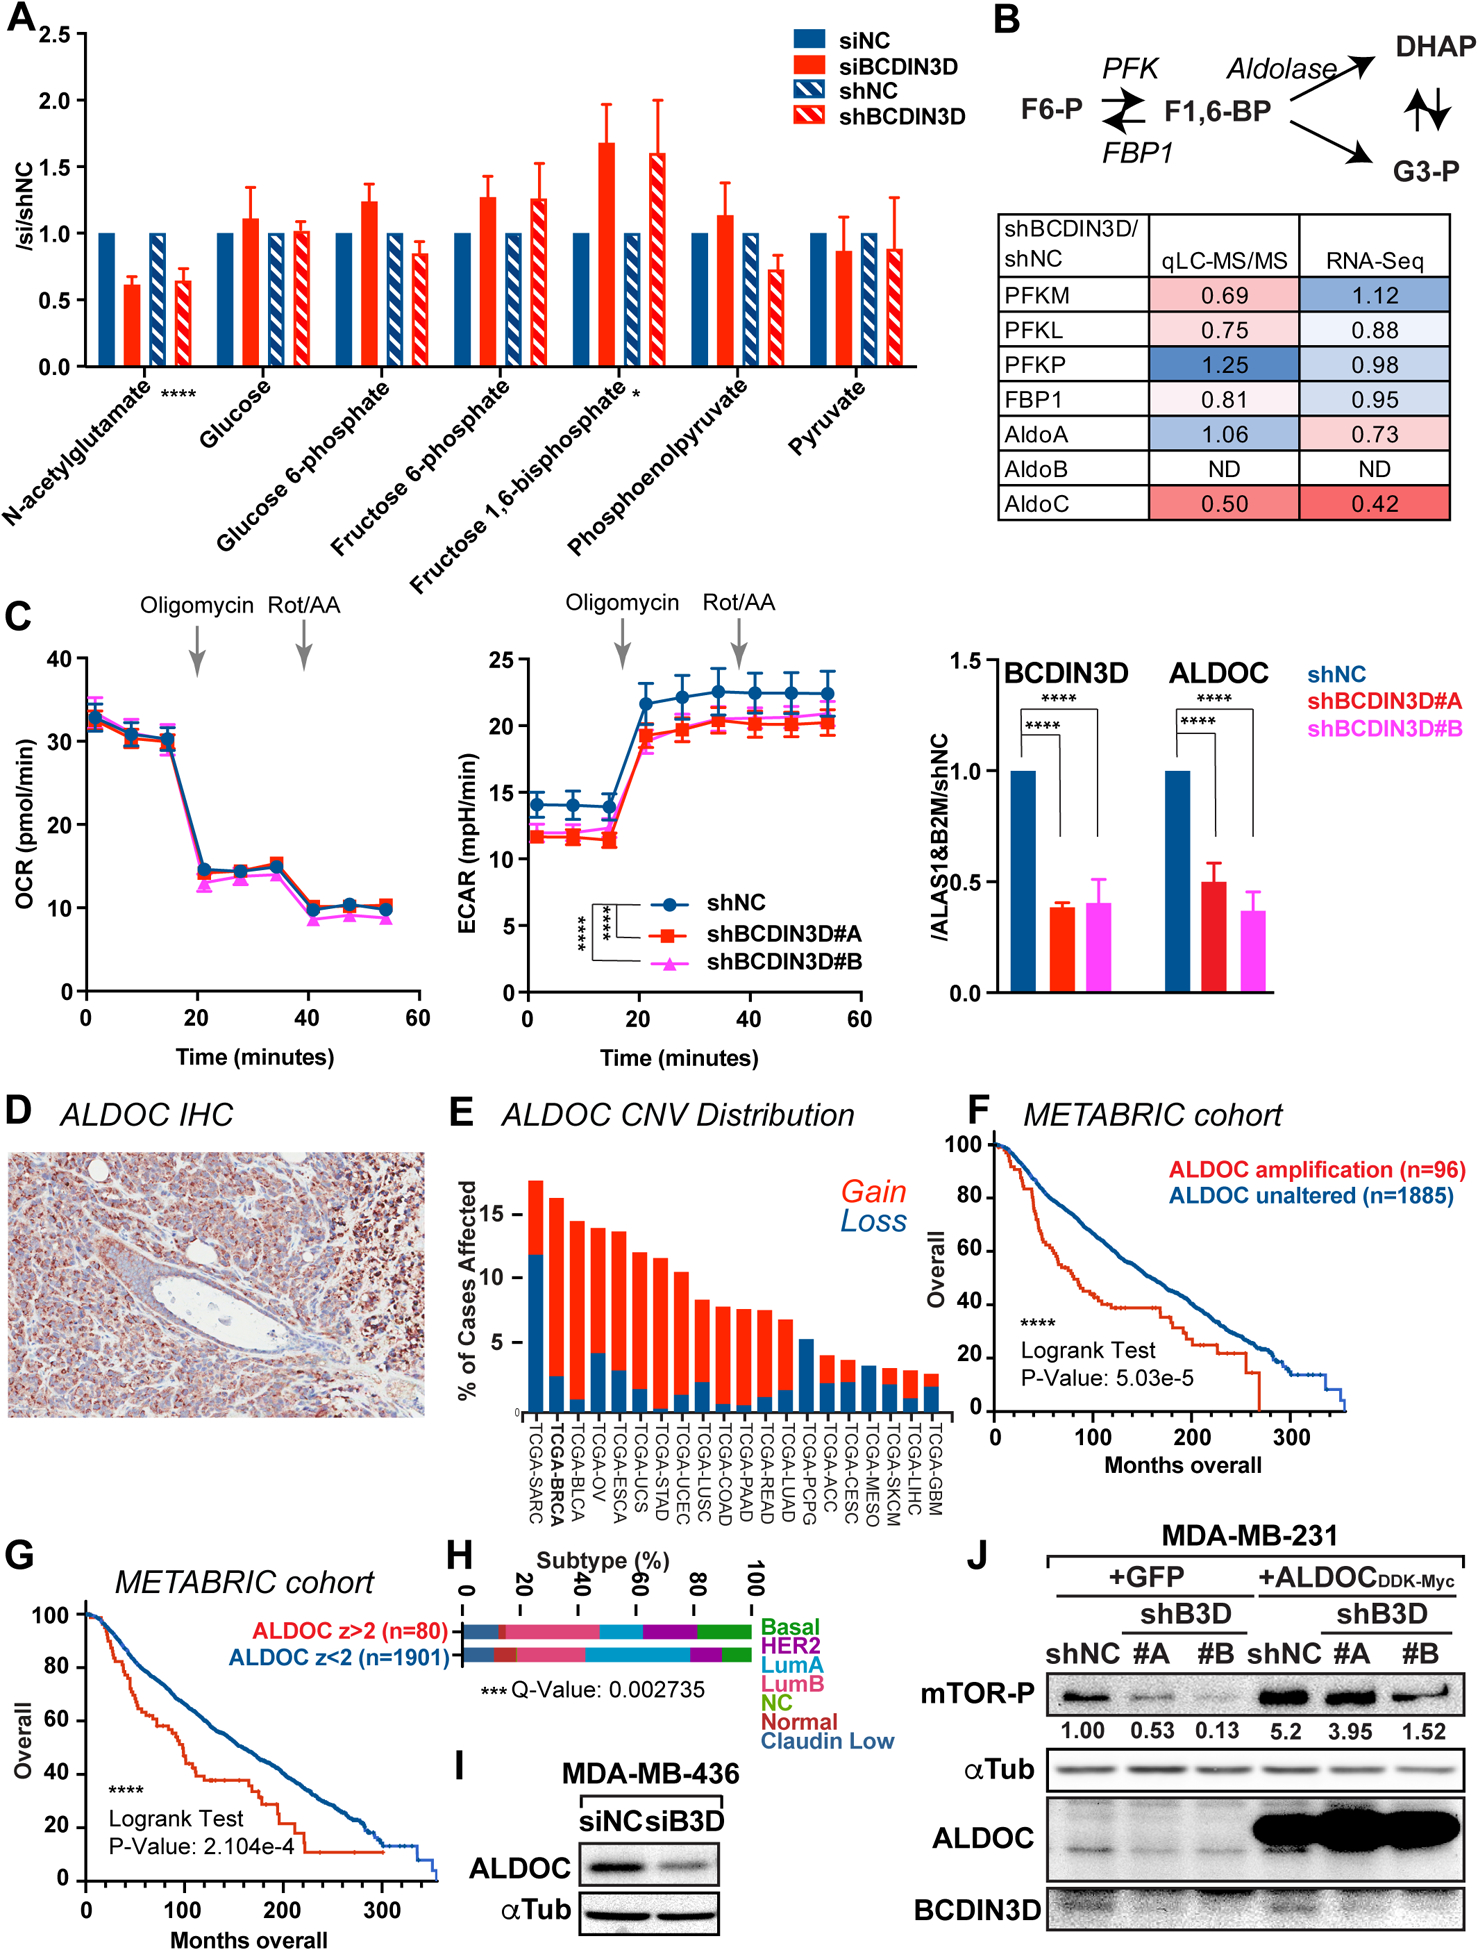
Figure 3. BCDIN3D regulates the levels of F1,6-BP and glycolysis through ALDOC.

a N-acetylglutamate and glycolysis pathway intermediates results from the untargeted profiling of primary metabolism in MDA-MB-231 cells where BCDIN3D is depleted via siRNA or shRNA. Data is normalized to siNC and shNC controls (mean ± SEM, n=4). The asterisks indicate the significant p-values between the control and BCDIN3D knock-down samples (multiple t-test).
b Results of expression levels of glycolysis pathway enzymes from the proteomic analysis (LC-MS/MS) and RNA-Seq in MDA-MB-231 shBCDIN3D compared to shNC cells. The color scale goes from the deepest shade of red for the lowest value to the deepest shade of blue for the highest value.
c Left and Middle: Kinetic profile of oxygen consumption rate (OCR) and extracellular acidification rate (ECAR) measurement of MDA-MB-231 shNC and shBCDIN3D #A and #B cells using a Real Time ATP rate assay kit in a Seahorse XFp apparatus [mean ± SEM, n=4 (i.e. 2×2)]. Injection of oligomycin (1.5 μM final concentration) results in an inhibition of mitochondrial ATP synthesis that results in a decrease in OCR, and an increase of glycolytic ATP production that results in an increase in ECAR. Complete inhibition of mitochondrial respiration with rotenone plus antimycin A (0.5 μM final concentration) enables calculation of mitochondrial-associated acidification, which is negligible in these cells. Right: BCDIN3D and ALDOC gene expression from MDA-MB-231 shNC and shBCDIN3D #A and #B cells. Data is normalized to ALAS1, B2M and shNC (mean ± SEM, n=3). The asterisks indicate significant p-values (2 way Anova with multiple comparisons).
d IHC of ALDOC from a representative xenograft tumor of MDA-MB-231 shNC cells in Foxn1nu/nu mice.
e Copy number variation (Gain in red, Loss in blue) of the ALDOC gene in different cancers from The Cancer Genome Atlas (TCGA), showing that Breast Cancer (BRCA) displays the highest number of copy number gain.
f Overall breast cancer patient survival status as a function of time in weeks (up to 360 weeks) and separated in two groups: having a ALDOC amplification (n=96) or not (n=1806) (METABRIC cohort analyzed on cBioPortal for Cancer Genomics).
g Overall breast cancer patient survival status as a function of time in weeks (up to 360 weeks) and separated in two groups: having high ALDOC mRNA level relative to diploid samples, z-score>2 (n=80) or not (n=1901) (METABRIC cohort analyzed on cBioPortal for Cancer Genomics).
h Distribution of patients defined in g as a function of PAM50 + Claudin-low subtypes (Chi Squared Test, p value = 3.646e-4, q value = 2.735e-4).
i ALDOC expression is also reduced upon siRNA-mediated knock-down of BCDIN3D in MDA-MB-436 basal B breast cancer cells.
j Overexpression of ALDOC increases mTOR signaling in MDA-MB-231 cells. Protein extracts from MDA-MB-231 shNC, shBCDIN3D#A-B cell lines stably expressing GFP or ALDOC were analyzed by western blot with the indicated antibodies. The numbers beneath the anti mTOR-P western blot corresponds to the mTOR-P signal normalized to αTubulin signal from the same western blot, and to shNC+GFP.
