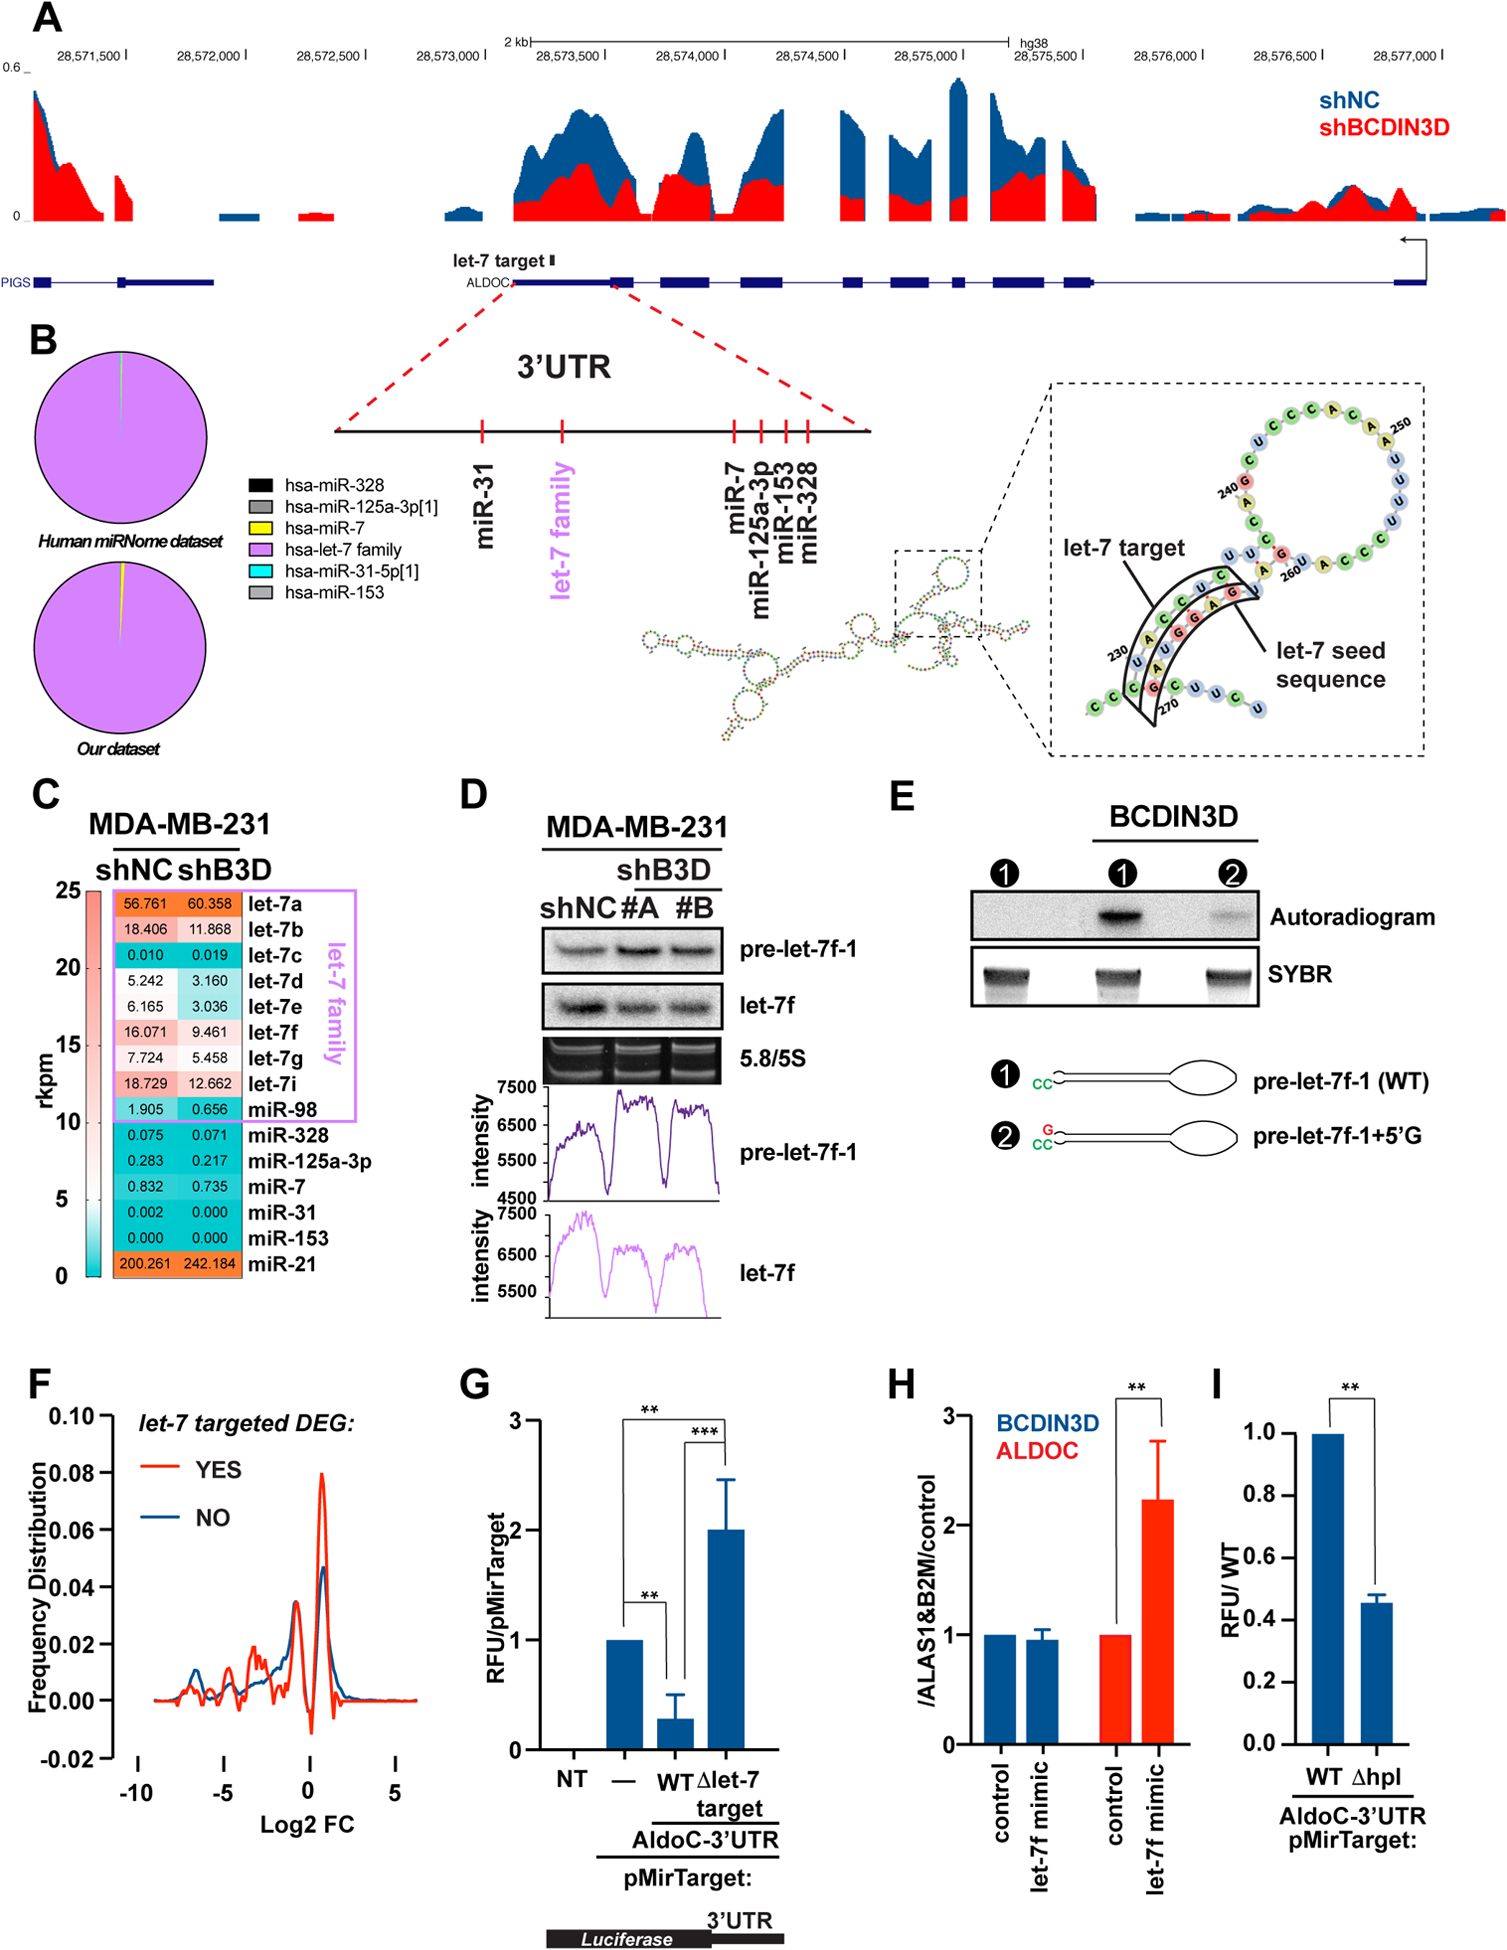
Figure 4. BCDIN3D stimulates ALDOC through a non-canonical mechanism involving let-7 microRNAs.

a UCSC genome browser traces of RNA-Seq in MDA-MB-231 shNC and shBCDIN3D cells at the ALDOC locus. The traces are overlaid, with the shNC trace (in blue) in the back position, and the shBCDIN3D trace (in red) in the forward position. The position of predicted miRNA target sites on the ALDOC 3’UTR is also indicated, together with the predicted structure of the ALDOC 3’UTR, overall or focused at the let-7 target site.
b Pie chart showing the relative levels of microRNAs that are predicted to target the ALDOC 3’UTR, in MDA-MB-231 cells from Human miRNome track hub [20] (top) and our dataset [2].
c Levels of microRNAs in reads per kilobase per million (rkpm) that are predicted to target the ALDOC 3’UTR, in MDA-MB-231 shNC and shBCDIN3D cells from our dataset [2] analyzed with a microRNA specific bioinformatic pipeline.
d 1 μg of RNA from MDA-MB-231 shNC and shBCDIN3D cells was analyzed by northern blot probed with the anti-let-7f probe, stripped, and re-probed with the anti-pre-let-7f-1 probe. 5/5.8 S panel shows the SYBR Gold stained gel at the level of the 5/5.8S ribosomal RNA (loading control). The bottom graphs show the raw intensity of the pre-let-7f-1 and let-7f signal quantified with ImageJ.
e in vitro RNA methyltransferase assay with recombinant BCDIN3D using radioactive [3H]-SAM as methyl group donor, and pre-let-7f-1-5’P precursor with either the WT predicted sequence, or containing an extra G nucleotide at the 5’ end. The bottom panel shows the SYBR stained gel that was used for the autoradiography in the top panel. See Fig. S8 for complete analysis.
f Distribution of differentially expressed genes (DEG) in MDA-MB-231 shBCDIN3D compared to shNC cells as a function of their logarithmic fold change, and separated into two groups: having a putative let-7 target site (red) or not (blue) by TargetScan. See Table S9 for complete information.
g MDA-MB-231 cells were transfected with pMirTarget (Origene) containing or not the 3’-UTR of ALDOC, either WT or having a deletion of the let-7 seed target (Δlet-7 target), fused to the Luciferase Reporter gene. 24h after transfection, the cells were lysed and the luciferase activity was measured in a luminometer. Data is normalized to pMirTarget transfected cells (mean ± SD, n=3). The asterisks indicate significant p-values (1 way Anova with multiple comparisons).
h BCDIN3D and ALDOC gene expression from MDA-MB-231 transfected with siNC (control) or let-7f mimic. Data is normalized to ALAS1, B2M and control (mean ± SD, n=2). The asterisks indicate significant p-values (Ratio paired t test).
i MDA-MB-231 cells were transfected with pMirTarget-ALDOC-3’-UTR, either WT or having a deletion of the hairpin loop (Δhpl) targeted by let-7, fused to the Luciferase Reporter gene and analyzed as in (G). The asterisks indicate significant p-values (Ratio paired t test).
