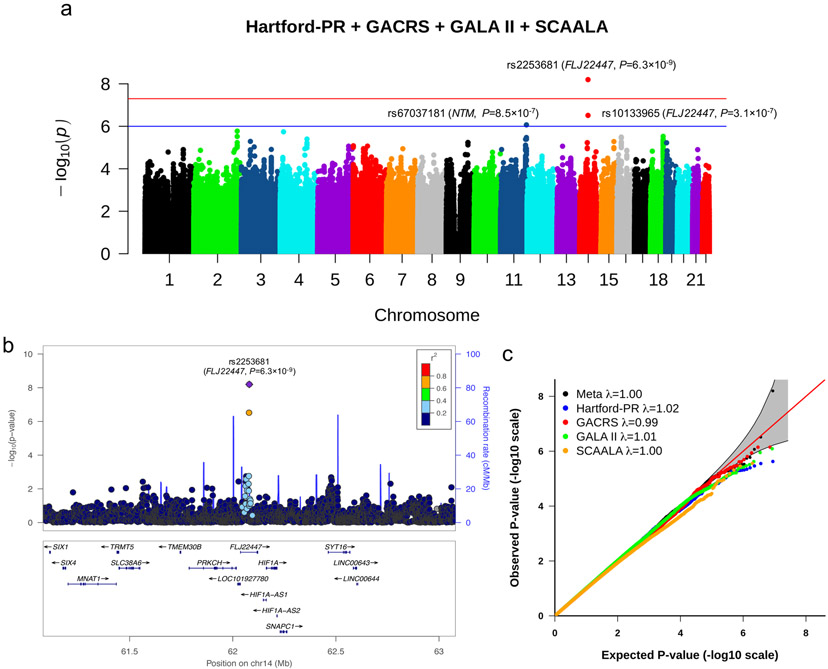
Figure 1.
1a) Manhattan plot of meta-analysis results: Manhattan plot showing the summary meta-analysis results of HPR, GALA II, GACRS, and SCAALA. The chromosomal position of each SNP is displayed along the X-axis and the negative logarithm of the association P-value is displayed on the Y-axis. The blue line represents the suggestive significance line (P < 1×10⁻⁶). The red line represents the genome-wide significance line (P < 5×10⁻⁸). HPR: Hartford-Puerto Rico cohort. GALA II: Genetics of Asthma in Latino Americans II. GACRS: Genetics of Asthma in Costa Rica Study, and the SCAALA (Social Changes, Asthma and Allergy in Latin America) Study. 1b) Results of the meta-analysis on the chromosome 14 region: The relative location of genes and the direction of transcription are shown in the lower portion of the figure, and the chromosomal position is shown on the x axis. The blue line shows the recombination rate across the region (right y axis), and the left y axis shows the significance of the associations. The purple diamond shows the P-value for rs2253681 that is the most significant SNP in the meta-analysis. The circles show the P-values for all other SNPs and are color coded according to the level of LD with rs2253681 in the 1000 Genome Project Admixed American (AMR) population. This plot was generated at www.locuszoom.org/. 1c) QQ plots for the meta-analysis. λ is the genomic control value.

