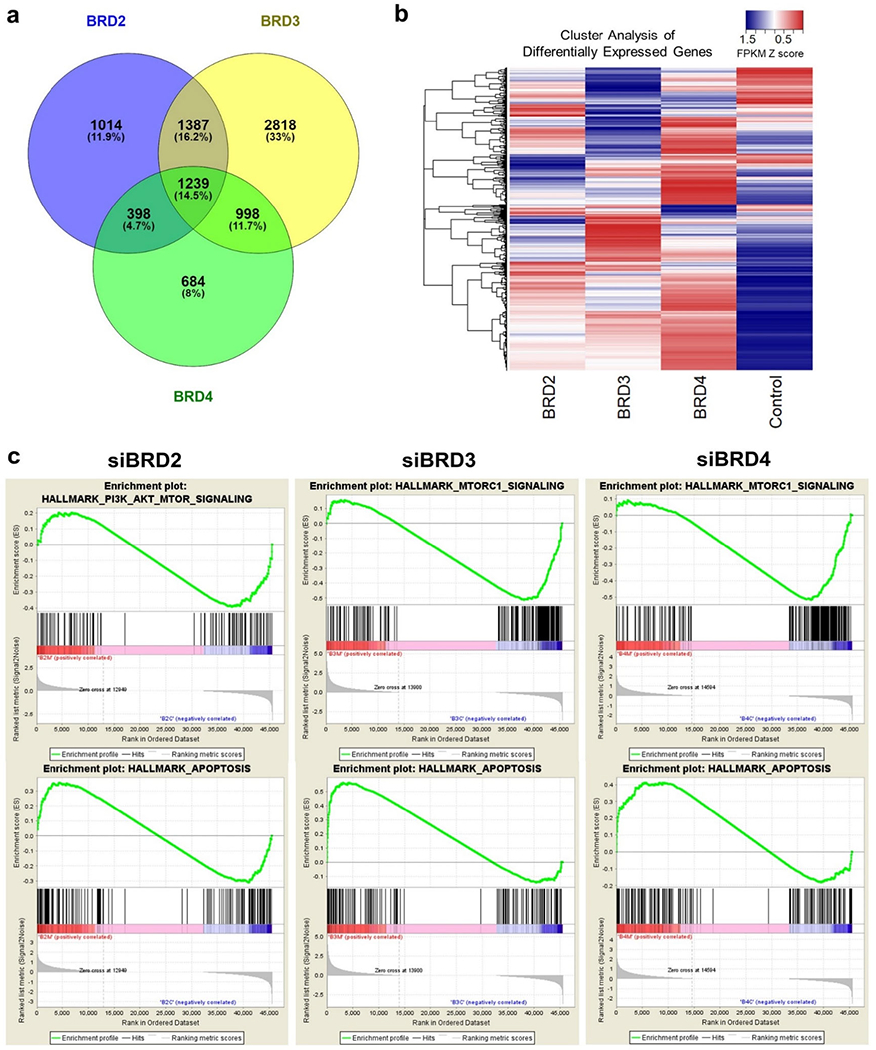
Figure 5. mRNA-Seq indicates acute depletion of each BET protein alters the PI3K-AKT signaling pathway.

(a) Venn diagram to summarize the mRNA-Seq results. The number of genes up- or down-regulated by each BET protein knockdown is shown. (b) Overview of the cluster analysis focusing on differentially expressed genes. FPKM was transformed to Z score and cluster analysis was performed. The result was visualized as a heatmap. (c) Results of Gene Set Enrichment Analysis (GSEA). FPKM values in triplicates between each BET protein knockdown and control were compared. Top: The enrichment of PI3K-AKT-MTORC or MTORC1 signaling gene set. Bottom: Gene set enrichment related to apoptosis.
