
Figure 2.
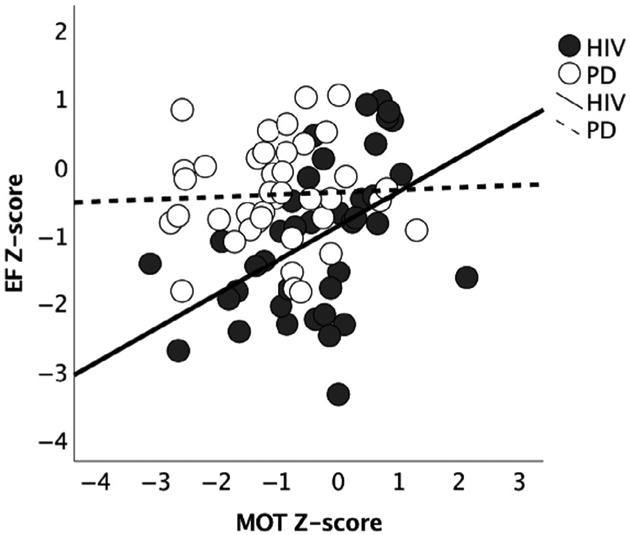
Correlation graphs depicting the relationship between EF and MOT in HIV and PD groups. Age- and education-corrected Z-scores denote deviation from CTRL mean = 0 (± 1 SD).
Official websites use .gov
A
.gov website belongs to an official
government organization in the United States.
Secure .gov websites use HTTPS
A lock (
) or https:// means you've safely
connected to the .gov website. Share sensitive
information only on official, secure websites.
Correlation graphs depicting the relationship between EF and MOT in HIV and PD groups. Age- and education-corrected Z-scores denote deviation from CTRL mean = 0 (± 1 SD).