
FIGURE 1.
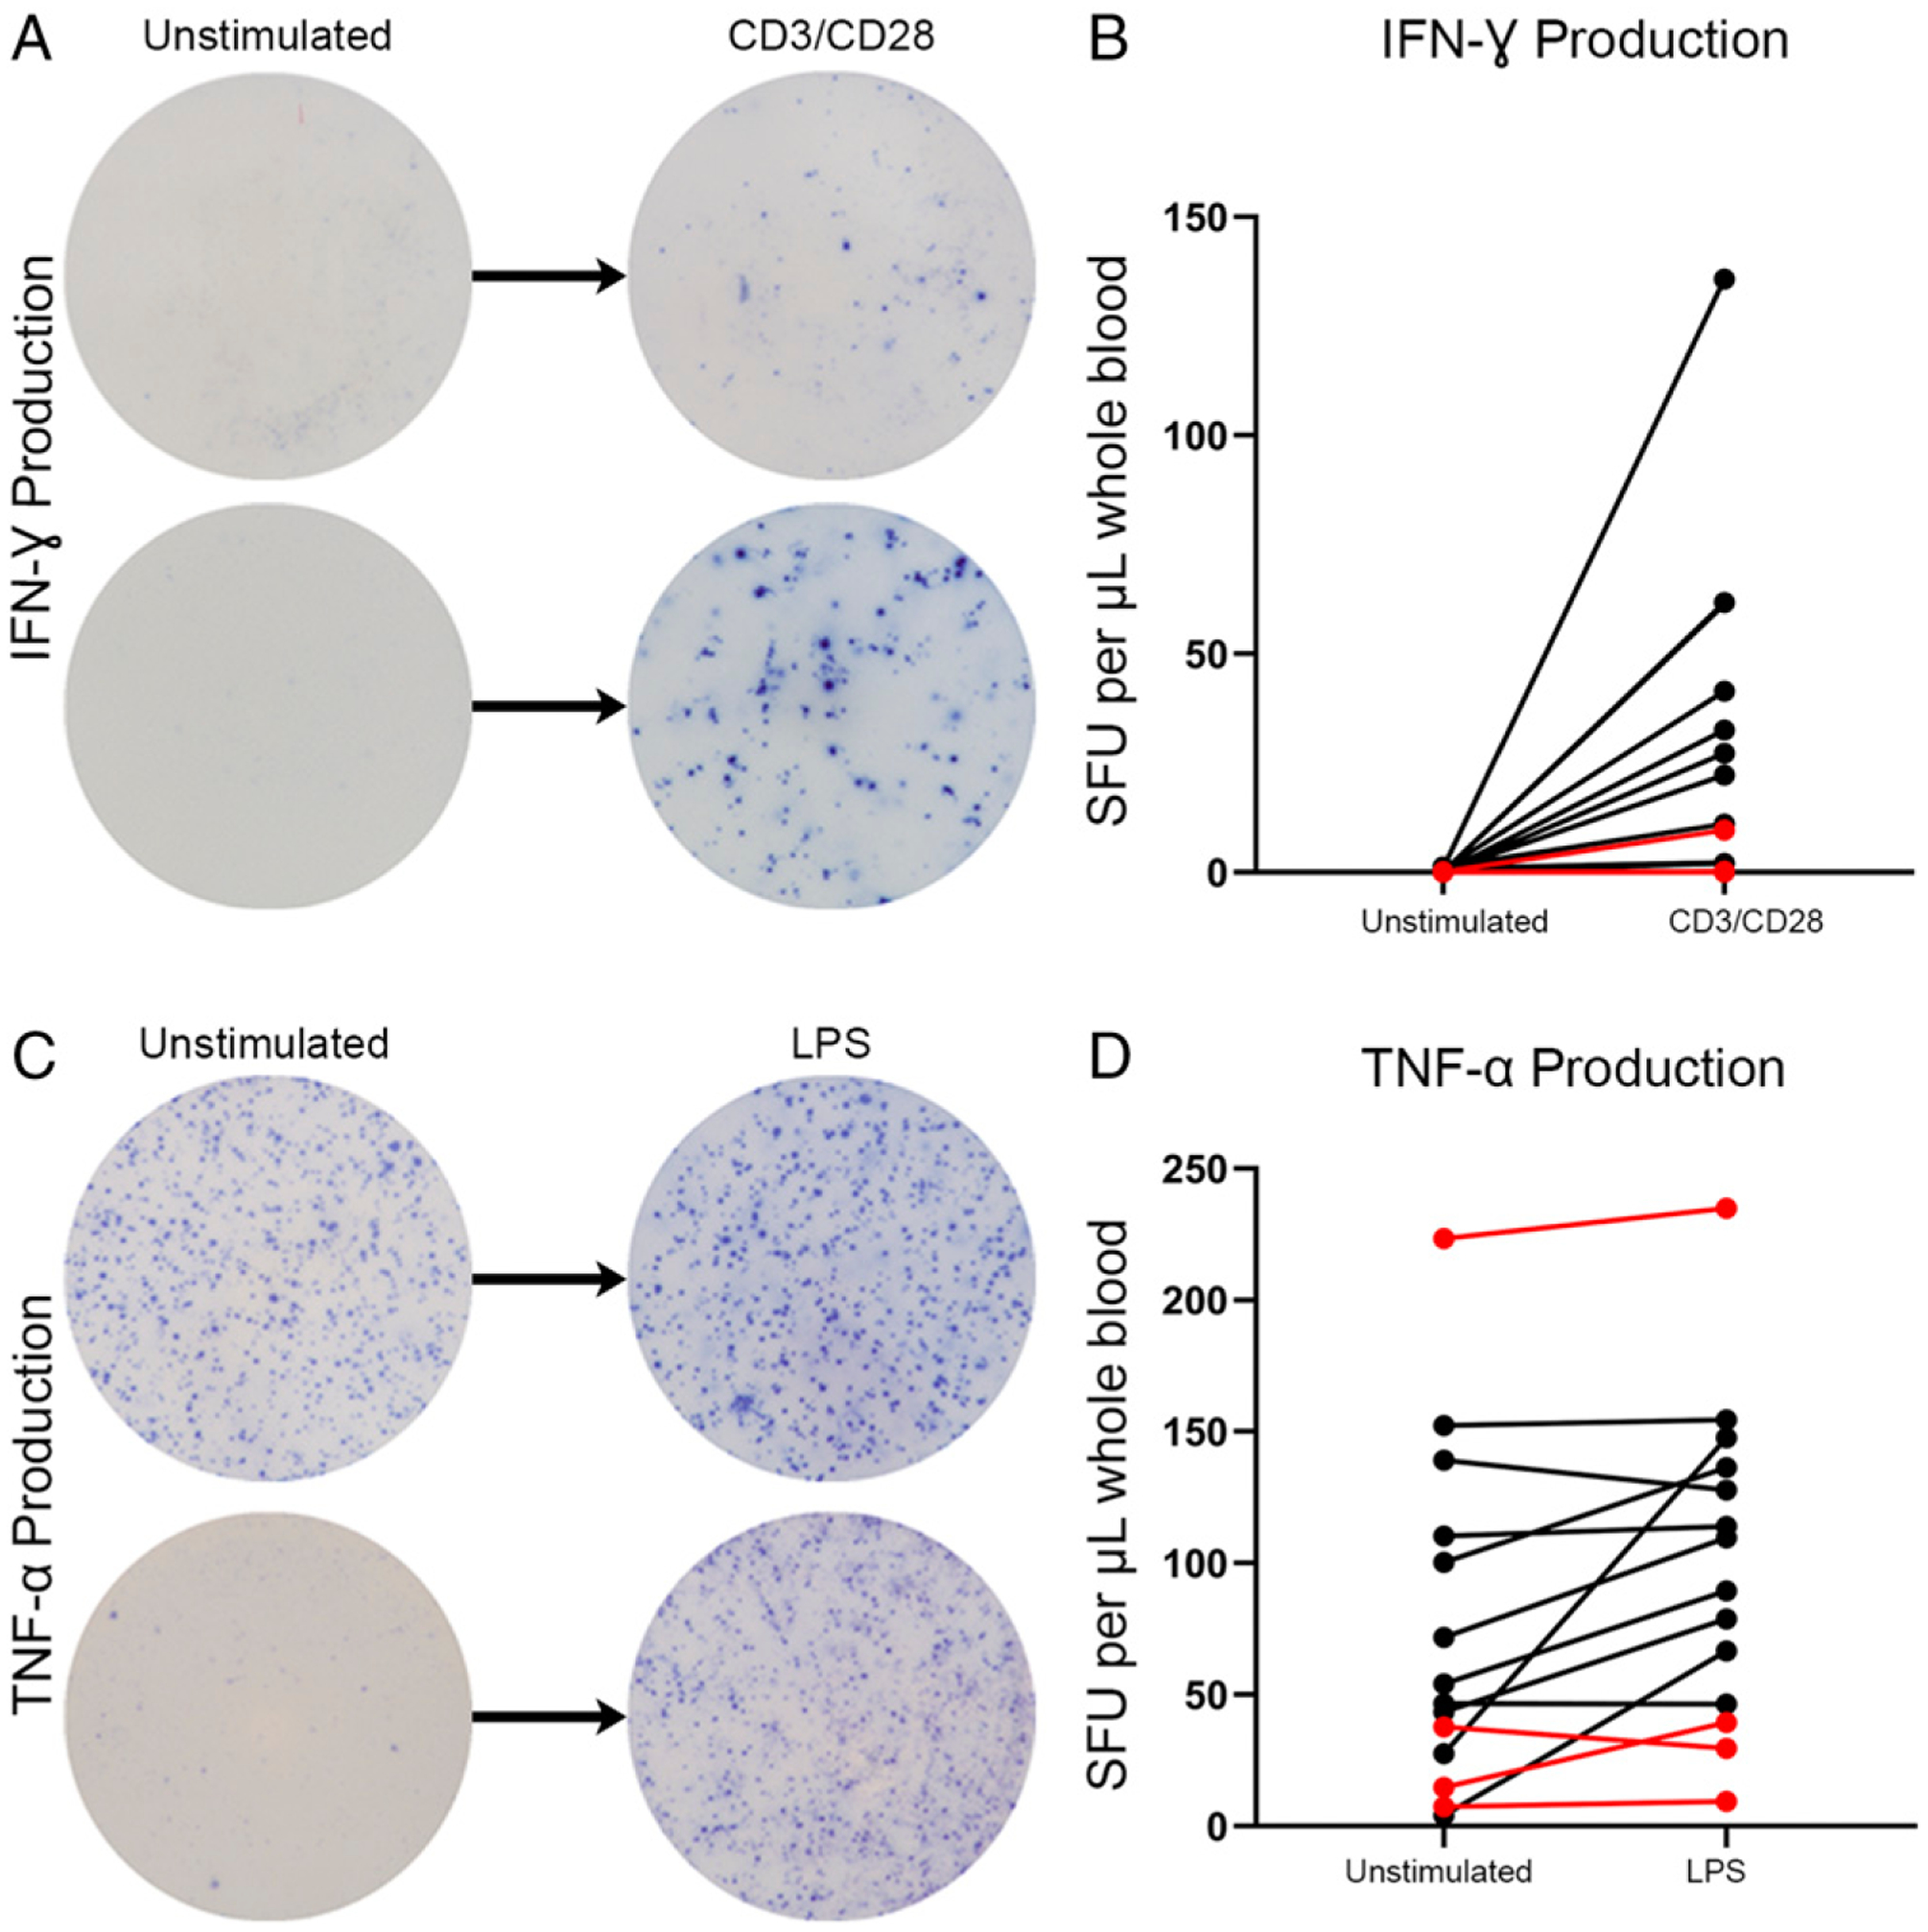
Unstimulated ex vivo production of IFN-γ and TNF-α in whole blood from septic patients using ELISpot assay. (A) Representative ELISpot images depicting IFN-γ production in media alone versus with CD3/CD28 Ab. (B) Graphic representation of n = 15 septic patient responses between unstimulated and stimulated ex vivo cytokine production of IFN-γ. (C) Representative ELISpot images depicting TNF-α production in media alone versus with LPS. (D) Graphic representation of n = 15 septic patient responses between unstimulated and stimulated ex vivo cytokine production of TNF-α. Red lines represent mortalities.