
FIGURE 4.
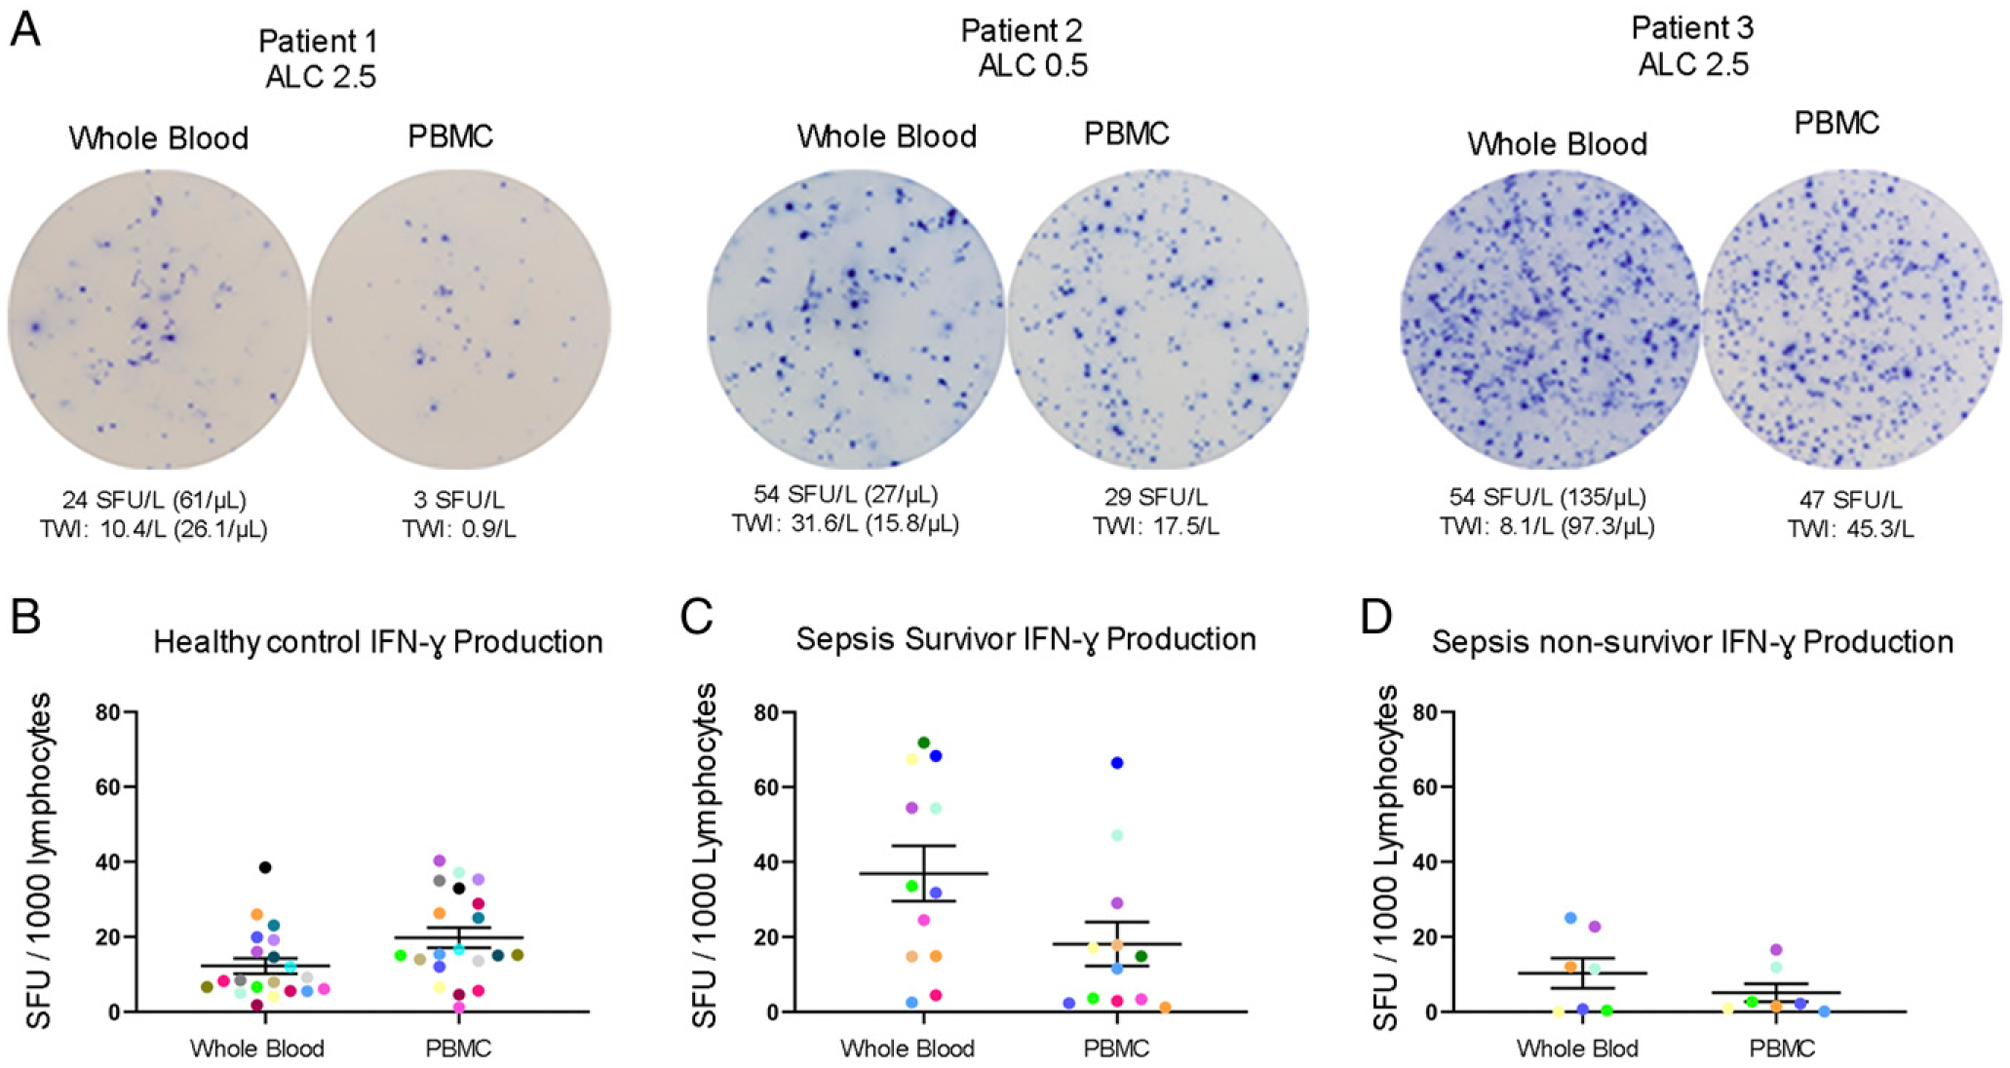
Comparison of T cell IFN-γ production in whole blood versus PBMCs ELISpot assay. (A) Representative figures depicting IFN-γ production of three individual patients using both whole blood and PBMC assays. (B–D) Dot plot graphs comparing data between whole blood and PBMC assays in healthy controls (n = 20), sepsis survivors (n = 12), and sepsis nonsurvivors (n = 7). Colored dots represent individual patients for comparison between assays. Each ELISpot assay was performed in duplicates. Bars represent mean ± SEM.